 Score
Analytical Techniques (A Level)
0. What Examiners Want
This guide covers Topic 37 of Cambridge International AS & A Level Chemistry 9701 (2025–27) and follows the learning outcomes below, word for word. The right-hand column shows where each one is taught. Section 6 combines the techniques with mass spectrometry and infrared spectroscopy (Topic 22) in the way Paper 4 does.
| 37 Analytical techniques. Candidates should be able to: | Section |
|---|---|
| 37.1 Thin-layer chromatography | |
| 1 describe and understand the terms (a) stationary phase, for example aluminium oxide (on a solid support) (b) mobile phase; a polar or non-polar solvent (c) Rf value (d) solvent front and baseline | 1 |
| 2 interpret Rf values | 1 |
| 3 explain the differences in Rf values in terms of interaction with the stationary phase and of relative solubility in the mobile phase | 1 |
| 37.2 Gas / liquid chromatography | |
| 1 describe and understand the terms (a) stationary phase; a high boiling point non-polar liquid (on a solid support) (b) mobile phase; an unreactive gas (c) retention time | 2 |
| 2 interpret gas / liquid chromatograms in terms of the percentage composition of a mixture | 2 |
| 3 explain retention times in terms of interaction with the stationary phase | 2 |
| 37.3 Carbon-13 NMR spectroscopy | |
| 1 analyse and interpret a carbon-13 NMR spectrum of a simple molecule to deduce: (a) the different environments of the carbon atoms present (b) the possible structures for the molecule | 3, 4, 6 |
| 2 predict or explain the number of peaks in a carbon-13 NMR spectrum for a given molecule | 4 |
| 37.4 Proton (1H) NMR spectroscopy | |
| 1 analyse and interpret a proton (1H) NMR spectrum of a simple molecule to deduce: (a) the different environments of proton present using chemical shift values (b) the relative numbers of each type of proton present from relative peak areas (c) the number of equivalent protons on the carbon atom adjacent to the one to which the given proton is attached from the splitting pattern, using the n + 1 rule (limited to singlet, doublet, triplet, quartet and multiplet) (d) the possible structures for the molecule | 5, 6 |
| 2 predict the chemical shifts and splitting patterns of the protons in a given molecule | 5 |
| 3 describe the use of tetramethylsilane, TMS, as the standard for chemical shift measurements | 3 |
| 4 state the need for deuterated solvents, e.g. CDCl3, when obtaining a proton NMR spectrum | 3 |
| 5 describe the identification of O–H and N–H protons by proton exchange using D2O | 5 |
- Chromatography: a correct Rf or percentage from the data, and an explanation that names the interaction with the stationary phase and the solubility in the mobile phase.
- Number of signals: the number of different environments, reached by spotting which atoms are equivalent.
- Chemical shift: each signal matched to a type of proton or carbon using the data table, with the group named.
- Area and splitting: the ratio of H atoms from the areas, and the neighbouring H count from n + 1.
- Structure: a formula that fits every signal and the molecular formula; one unexplained signal costs the mark.
- Method: the reason for TMS, CDCl3 and D2O, and what each does to the spectrum.
1. Thin-Layer Chromatography
Chromatography separates a mixture into its components. Every method has a stationary phase that stays still and a mobile phase that moves through or over it, carrying the sample. Components that spend more time in the mobile phase travel further. In thin-layer chromatography (TLC) the stationary phase is a thin layer of a solid, usually aluminium oxide (alumina, Al2O3) spread on a glass or plastic plate. The mobile phase is a liquid solvent, which can be polar or non-polar, and it rises up the plate by capillary action.
A spot of the mixture is placed on a pencil line, the baseline, and the plate stands in a little solvent in a covered tank. When the solvent has risen almost to the top, the plate is removed and the height reached is marked at once: this is the solvent front. Colourless spots are located with ultraviolet light or by spraying with a locating agent (for example ninhydrin for amino acids).
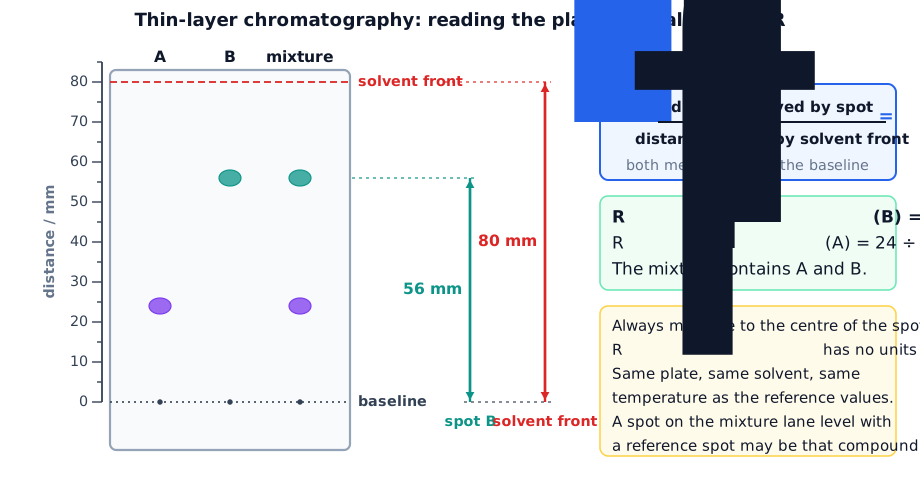
| Term | Meaning |
|---|---|
| stationary phase | the solid (for example Al2O3) on the plate; it adsorbs the solutes |
| mobile phase | the solvent that rises up the plate, polar or non-polar |
| baseline | the pencil line where the sample is spotted |
| solvent front | the highest point reached by the solvent |
| Rf value | distance moved by the spot ÷ distance moved by the solvent front |
Why compounds travel different distances
Alumina is a polar solid. A polar molecule, such as propanone, is attracted strongly to its surface and is adsorbed; it spends little time in the solvent and moves a short distance, so it has a low Rf. A non-polar molecule, such as hexane, is attracted only weakly to the surface and dissolves well in a non-polar solvent such as methylbenzene, so it moves far and has a high Rf. TLC is normally an adsorption method, although a layer of water on the alumina can also let the solutes partition between the water and the solvent. Switching to a more polar solvent carries every spot higher, because the solvent competes with the solutes for the surface.
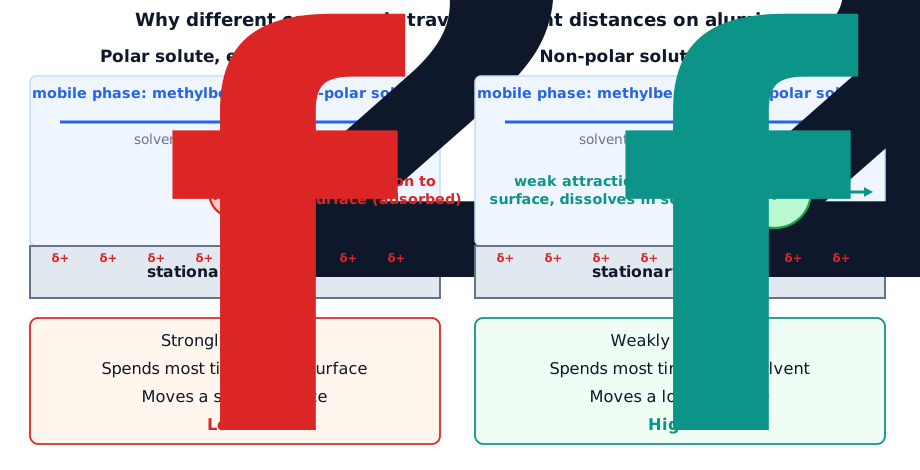
Worked example. A spot of a dye moves 4.6 cm on a TLC plate while the solvent front moves 8.0 cm. Calculate the Rf value. A second compound has Rf = 0.80 under the same conditions. Which is the more polar? [3]
Rf = 4.6 ÷ 8.0 = 0.58 [1]. The compound with the lower Rf (0.58) is the more polar [1], because it is adsorbed more strongly on the polar aluminium oxide and is less soluble in the (non-polar) solvent [1].
2. Gas–Liquid Chromatography
In gas–liquid chromatography (GLC) a vaporised sample is carried through a long, coiled column by an unreactive carrier gas, the mobile phase, such as helium or nitrogen. The column holds the stationary phase: a non-volatile, high-boiling-point, non-polar liquid coated on a solid support such as tiny silica particles. The oven keeps the column hot enough for every component to stay as a gas. Components that interact more strongly with the liquid take longer to come out of the column.

The detector records a peak as each component leaves the column. The time from injection to the maximum of a peak is its retention time. Each compound has its own retention time under fixed conditions (same column, carrier gas, flow rate and temperature), so the peaks are identified by comparing retention times with those of known compounds.
Explaining retention times. In the usual non-polar column, the order depends on how strongly each component is attracted to the stationary liquid. The stronger the intermolecular forces with the non-polar liquid (mainly induced dipole–dipole forces, which increase with the number of electrons and the length of the chain), the longer the component stays in the column and the longer its retention time. A component with a lower boiling point or weaker interaction spends more time in the gas and emerges earlier. A more polar stationary phase would hold polar components for longer and could change the order of the peaks.

Percentage composition. The area under a peak is proportional to the amount of that component, provided that every component gives a peak, all are separated and the detector responds equally to each. The peaks are roughly triangular, so area = ½ × base × height; many instruments print the areas. If the peaks are narrow and have similar widths, the heights can be used instead.
GLC is limited to samples that can be vaporised without decomposing, and similar compounds can have almost the same retention time. When it is linked to a mass spectrometer (GC–MS), each separated component goes straight into the spectrometer and is identified from its own mass spectrum.
Worked example. A chromatogram of a mixture of three esters shows peaks of area 12, 30 and 18 (arbitrary units). Calculate the percentage of the ester with the area 30. [2]
Total area = 12 + 30 + 18 = 60 [1]. Percentage = 30 ÷ 60 × 100 = 50% [1].
Worked example. Hexane, heptane and octane are separated on a non-polar column. Predict the order in which they leave the column and explain it. [3]
Hexane, then heptane, then octane [1]. Octane has the most electrons and the strongest induced dipole–dipole forces with the non-polar liquid stationary phase [1], so it is held longest and has the longest retention time; hexane has the weakest and emerges first [1].
3. How NMR Works
Nuclear magnetic resonance (NMR) spectroscopy uses nuclei that behave like tiny magnets. Nuclei with an odd mass number, such as 1H and 13C, spin; 12C does not. In a strong magnetic field a spinning nucleus lines up with the field (lower energy) or against it (higher energy). The gap, ΔE, corresponds to radio-wave energy. A nucleus absorbs this energy and flips to the higher level, and this absorption is detected as a peak.

The electrons around a nucleus shield it a little from the field, so the size of ΔE depends on the chemical environment of the nucleus. Atoms in different environments absorb at different places. The position of a peak is its chemical shift, δ, measured in parts per million (ppm) from a reference compound. Equivalent atoms (in identical environments) give a single signal.
TMS. The reference is tetramethylsilane, Si(CH3)4, set at δ = 0. It is chosen because it is inert, volatile (so it is easy to remove) and mixes well with organic compounds; its 12 H atoms are all equivalent, so it gives one sharp peak; and that peak is at a lower δ than almost every other proton. The same compound is the reference for 13C spectra.
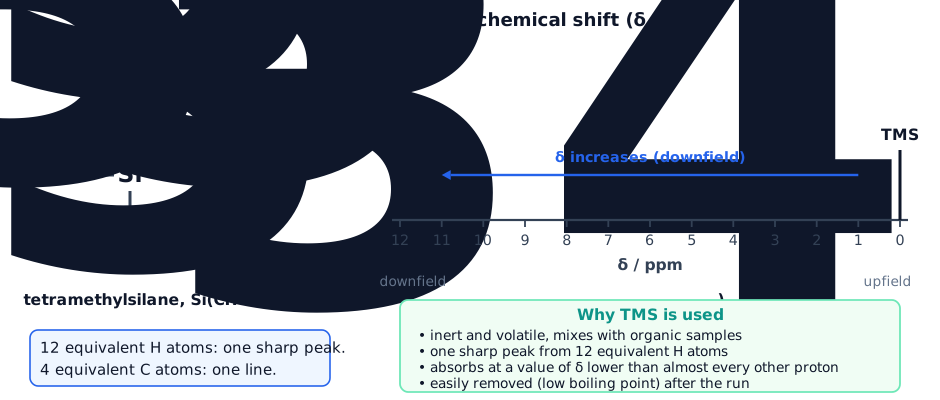
Solvents. A sample is dissolved in a solvent for NMR. An ordinary solvent with H atoms, such as CHCl3, would give its own large 1H peak. A deuterated solvent, such as CDCl3, contains 2H (deuterium) in place of 1H. Deuterium does not absorb in the 1H NMR range, so the solvent gives no signal that could hide or be mistaken for a signal of the sample. (Tetrachloromethane, CCl4, has no H at all, but CDCl3 dissolves more compounds.)
4. Carbon-13 NMR
About 1% of carbon atoms are 13C, which is enough to give a spectrum. In a standard 13C spectrum each different carbon environment gives one vertical line, and there is no splitting. The line heights are not proportional to the number of carbon atoms, so they cannot be used for counting. The small signal near δ = 77 comes from the solvent CDCl3 and is ignored.
Counting lines. Two carbon atoms are equivalent if they are in identical surroundings, usually because of symmetry. Draw the molecule and ask for each carbon: what is it bonded to, and does another carbon have the same set of neighbours? Each set of equivalent atoms gives one line.
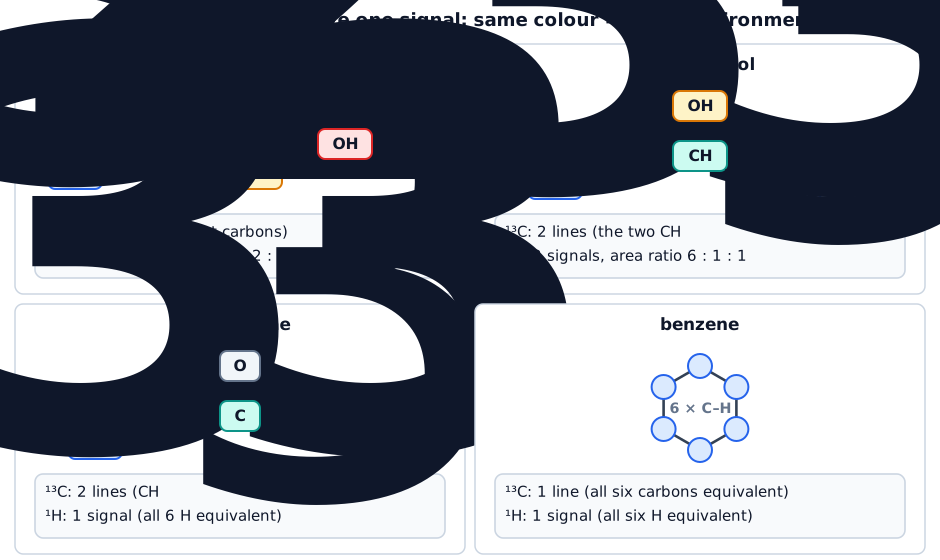

Each line is matched to a type of carbon using the shift. A carbon bonded to an electronegative atom (O, halogen) is deshielded and appears at a larger δ; a C=O carbon is the largest of all. An aldehyde or ketone carbonyl (190–220) is distinguished from an ester or carboxylic acid carbon (160–185); an alkene or arene carbon (110–160) is distinguished from an alkyl carbon (0–50).
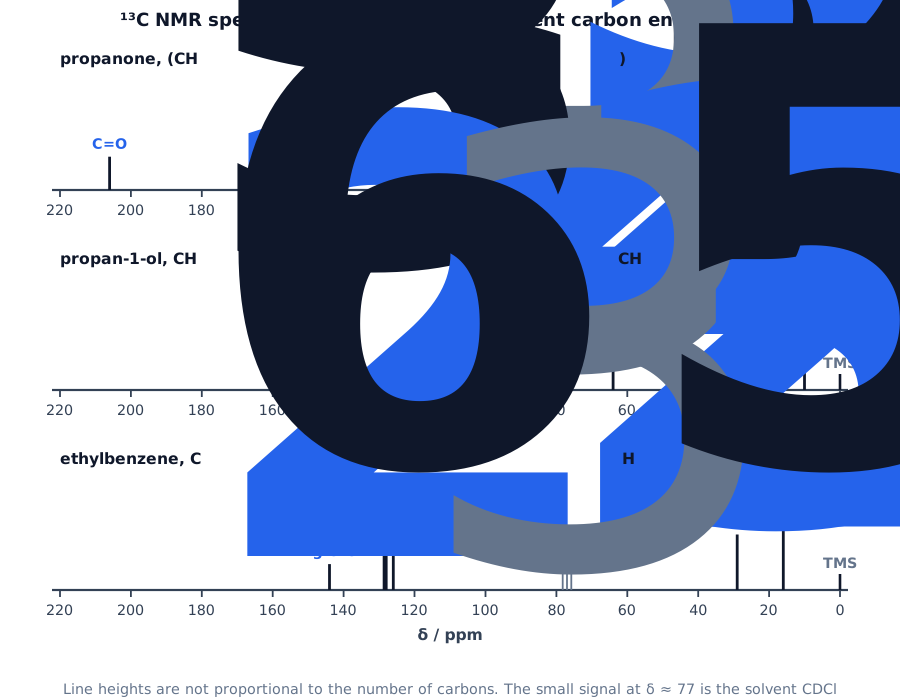
Worked example. State the number of lines in the 13C NMR spectrum of (i) propan-1-ol, (ii) propan-2-ol, (iii) benzene, (iv) 1,4-dimethylbenzene. [4]
(i) 3, three different carbons [1]. (ii) 2, the two CH3 carbons are equivalent [1]. (iii) 1, all six carbons are equivalent [1]. (iv) 3: CH3, the ring carbons bonded to CH3, and the ring CH carbons [1].
Worked example. The 13C NMR spectrum of an organic compound with the formula C3H6O has two lines, at δ = 30 and δ = 206. Deduce its structure. [3]
Two lines mean two carbon environments [1]. δ = 206 is in the range 190–220, so it is a C=O group of an aldehyde or ketone [1]. δ = 30 is alkyl carbon; two equivalent CH3 groups on the C=O fit the formula, so the compound is propanone, (CH3)2C=O [1]. (Propanal, CH3CH2CHO, would give three lines.)
5. Proton NMR
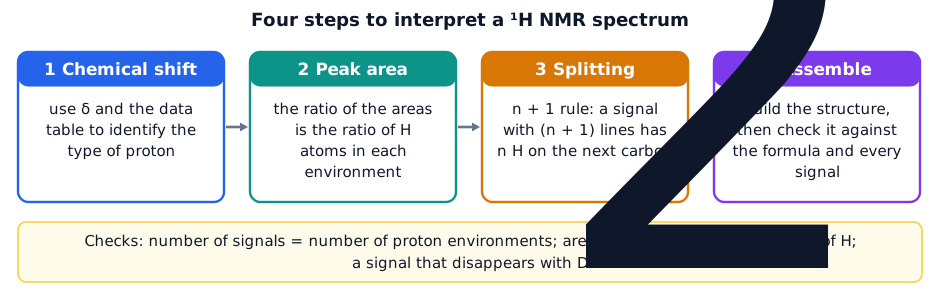
A 1H (proton) NMR spectrum gives three pieces of information about every set of equivalent H atoms: where the signal is (chemical shift), how big it is (area) and what it looks like (splitting). The number of signals equals the number of different proton environments.
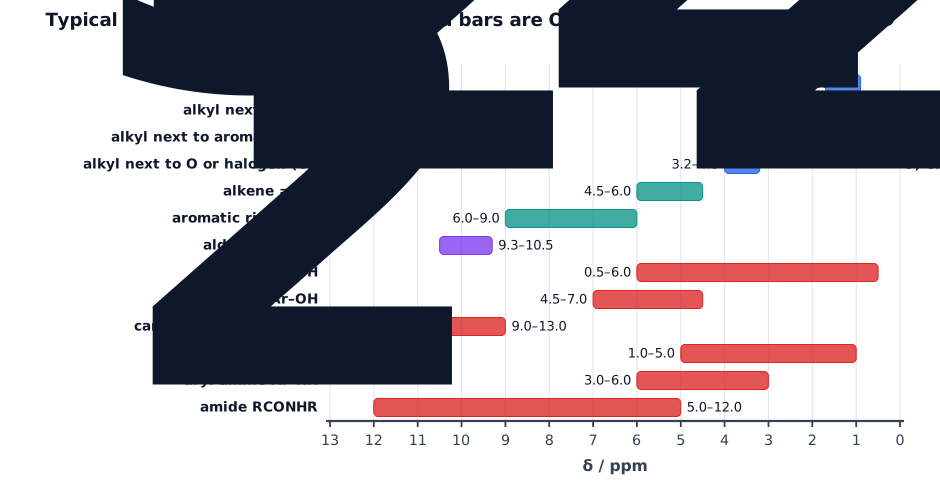
Chemical shift. The shift shows the environment of the proton. H atoms next to electronegative atoms or groups (O, halogen, C=O, a benzene ring) are deshielded and have a larger δ. The chart gives the typical ranges; O–H and N–H shifts are variable because they depend on solvent and concentration.
Peak area. The area under a signal is proportional to the number of H atoms in that environment. The ratio of the areas (given as numbers, integration steps or labels) is the ratio of the H atoms, and the areas add up to the total number of H in the molecule (or to a multiple of it).
Splitting and the n + 1 rule. The magnetic fields of H atoms on adjacent carbon atoms affect each other (spin–spin coupling). A signal from H atoms whose adjacent carbon has n H atoms is split into n + 1 lines. The syllabus names singlet (n = 0), doublet (1), triplet (2) and quartet (3); a signal of more than four lines is a multiplet. The relative heights follow Pascal’s triangle.
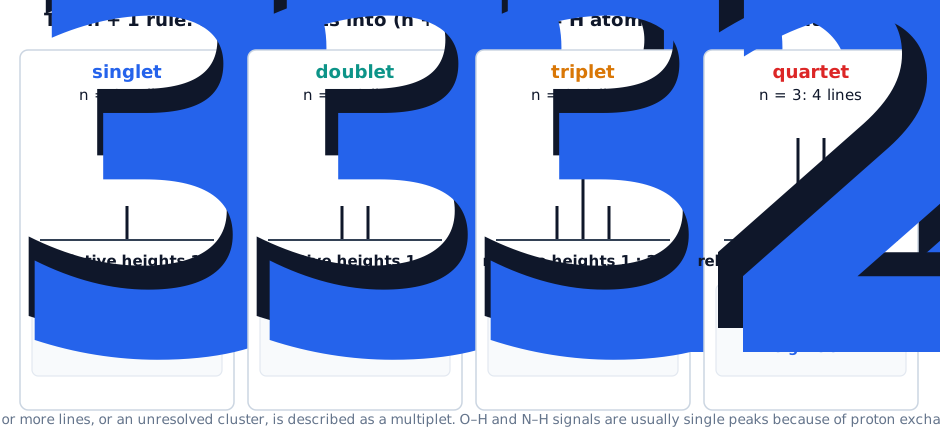
Equivalent H atoms do not split each other. The CH2 in CH3CH2– is split only by the H atoms of the CH3, and the CH3 only by those of the CH2. If the neighbouring carbon has no H (for example C=O or a quaternary carbon) the signal is a singlet.

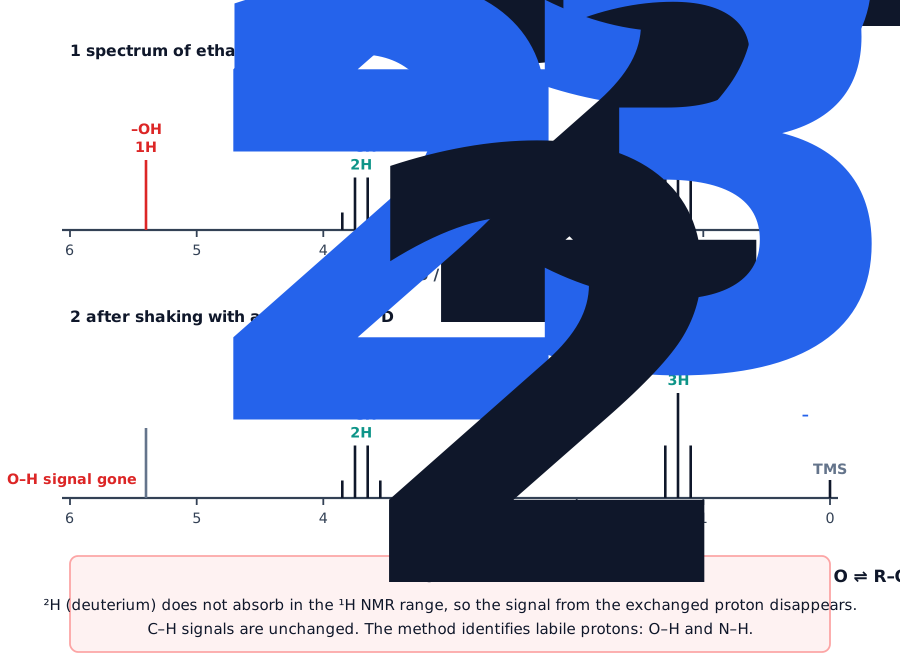
O–H and N–H protons. These protons exchange rapidly with H atoms of other molecules and with traces of water or acid, so they are normally not split and give a single peak at a variable shift. To identify one, a few drops of D2O are added and the sample is shaken. The H of the O–H or N–H is swapped for deuterium: R–OH + D2O ⇌ R–OD + HOD. Deuterium does not absorb in the 1H range, so that signal disappears. Signals from C–H protons stay where they were.
Worked example. Predict the 1H NMR spectrum of propan-2-ol, (CH3)2CHOH: the number of signals, the relative areas, the type of proton and the splitting of each. [5]
Three signals [1]. (1) δ about 1.2, relative area 6, two equivalent CH3 next to CH, doublet (n = 1) [1]. (2) δ about 4.0, area 1, the CH next to O, split by 6 H into a multiplet (septet) [1]. (3) δ about 2 (variable), area 1, the O–H, a singlet [1]. It disappears when D2O is added [1].
Worked example. Predict the number of signals, their areas and their splitting in the 1H NMR spectrum of propan-1-ol, CH3CH2CH2OH. [4]
Four signals, area ratio 3 : 2 : 2 : 1 [1]. CH3 (δ about 0.9): triplet, next to CH2 [1]. Middle CH2 (δ about 1.6): multiplet, next to 5 H [1]. OCH2 (δ about 3.6) is a triplet; the O–H is a singlet [1].
6. Putting It Together
Paper 4 gives the molecular formula (from combustion data or the mass spectrum), a spectrum and often some chemistry. Work through the data in the same order each time.
| Technique | What it tells you |
|---|---|
| mass spectrum | Mr from the M+ peak; M + 1 peak for number of C; M + 2 for Cl and Br; fragments |
| infrared | functional groups: O–H, C=O, C–H, N–H |
| 13C NMR | number of carbon environments; type of each carbon from δ |
| 1H NMR | number of proton environments; H ratio from areas; neighbours from splitting; O–H and N–H with D2O |
| TLC, GLC | the number of components and the percentage composition |
Worked example. An ester, used as a solvent in a glue, has the 1H NMR spectrum shown. Identify it. [5]
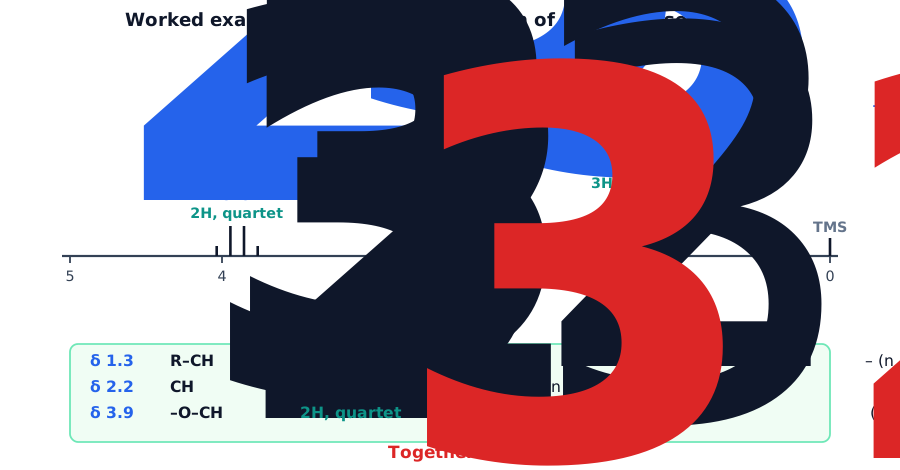
δ 1.3, area 3, triplet: CH3 next to CH2 [1]. δ 2.2, area 3, singlet: CH3 next to C=O, with no H on the next atom [1]. δ 3.9, area 2, quartet: O–CH2 next to CH3 [1]. The pieces CH3CO– and –O–CH2CH3 make an ester [1]: CH3COOCH2CH3, ethyl ethanoate [1].
Worked example. Compound P (C4H8O2) has a 1H NMR spectrum with signals at δ 1.1 (triplet, 3), 2.3 (quartet, 2) and 3.7 (singlet, 3). Its 13C spectrum has four lines. Identify P and state why it is not its isomer ethyl ethanoate. [4]
δ 1.1 triplet 3H: CH3CH2– [1]. δ 2.3 quartet 2H: CH2 next to the CH3 and to C=O [1]. δ 3.7 singlet 3H: CH3–O with no neighbouring H [1]. So P is methyl propanoate, CH3CH2COOCH3; ethyl ethanoate would have a CH3 singlet near 2.2, and an OCH2 quartet near 3.9 [1].
7. Quick Sheet and Checklist
| Topic | What to remember |
|---|---|
| TLC | stationary phase Al2O3; Rf = spot distance ÷ front distance; polar compound adsorbed more, lower Rf |
| GLC | mobile phase: unreactive gas; stationary phase: high b.p. non-polar liquid; retention time; % = area ÷ total × 100 |
| 13C NMR | one line per carbon environment; no splitting; heights not proportional; C=O 190–220 |
| 1H NMR | signals = environments; area = H ratio; n + 1 splitting; multiplet for more than four lines |
| TMS | δ = 0; inert, volatile, one sharp peak |
| CDCl3 | deuterated solvent, no 1H signal |
| D2O | O–H and N–H signals disappear |
- [ ] I can define stationary phase, mobile phase, baseline, solvent front and Rf, calculate Rf and explain differences in Rf using adsorption and solubility.
- [ ] I can describe GLC, define retention time, explain retention times and calculate a percentage composition from peak areas.
- [ ] I can count the lines in a 13C spectrum, match each to a carbon environment using the shift table and use them to choose between isomers.
- [ ] I can use shifts, areas and the n + 1 rule to deduce a structure from a 1H spectrum, and predict the spectrum of a given molecule.
- [ ] I can state why TMS, CDCl3 and D2O are used and describe the effect of D2O on a spectrum.