 Score
Analytical Techniques
0. What Examiners Want
- Infrared: the bond and the functional group for each absorption, with the wavenumber quoted from the table (‘C=O, 1670–1740, carbonyl’).
- Absence as evidence: no O–H absorption and no C=O absorption are results too, and they rule structures out.
- Mass spectra: M+ gives Mr; the [M+1]+ peak gives the number of carbons; the [M+2]+ peak gives Cl or Br; fragment peaks give pieces of the structure.
- Calculations: relative atomic mass from isotopic abundances, and the number of carbon atoms from [M+1], both with the working shown. Use the Periodic Table in the Data Booklet.
- Linking: combining the IR spectrum, the mass spectrum and the test reactions of Topics 14 to 21 to identify a compound.
Where this topic appears. Recent AS papers have asked for: a Paper 1 question matching an infrared spectrum to one of four compounds (for example which diagram shows a compound with both C=O and O–H, or which compound could give a given spectrum); a Paper 2 question using the [M+1]+ and M+ abundances of an ester to show that it has seven carbon atoms and the infrared spectrum to identify its functional group (2024 Paper 2); a comparison of the infrared spectra of two compounds above 1500 cm−1 (2023 Paper 2); and a prediction of how the spectra of a monomer and its polymer differ (2022 Paper 2). At AS, no knowledge of how the instruments work is needed. NMR and chromatography belong to A Level (Topic 37).
1. Infrared Spectroscopy
Covalent bonds are always vibrating (stretching and bending). A bond absorbs infrared radiation of the frequency that matches its own vibration, so each type of bond absorbs at its own characteristic wavenumber, measured in cm−1. An infrared spectrum plots transmittance (%) against wavenumber. An absorption shows as a downward peak: the deeper the peak, the more radiation absorbed. Wavenumber is plotted with the highest value on the left.
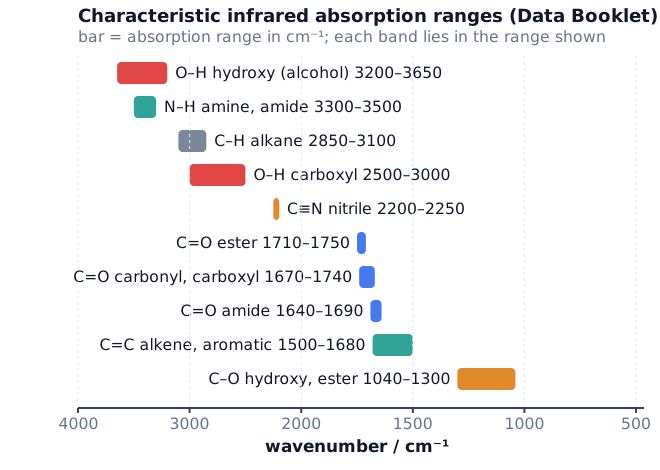
| Bond | Functional groups containing the bond | Absorption range / cm−1 |
|---|---|---|
| C–O | hydroxy, ester | 1040–1300 |
| C=C | aromatic compound, alkene | 1500–1680 |
| C=O | amide | 1640–1690 |
| C=O | carbonyl, carboxyl | 1670–1740 |
| C=O | ester | 1710–1750 |
| C≡N | nitrile | 2200–2250 |
| C–H | alkane | 2850–3100 |
| N–H | amine, amide | 3300–3500 |
| O–H | carboxyl | 2500–3000 |
| O–H | hydroxy | 3200–3650 |
Some papers print slightly different limits for C–H (2850–2950) and hydroxy O–H (3200–3600): always use the table printed in your paper. The table is printed in the question paper, so you do not need to memorise every number, but you must know which bonds are in it and the order along the axis. A useful picture: from the left, O–H and N–H (3200–3650), then C–H (about 3000), then C≡N (about 2200), then the C=O and C=C region (1500–1750), and C–O to the right (1040–1300).
2. Reading Infrared Spectra
Read a spectrum in four steps. (1) Look above 3000 cm−1 for O–H or N–H. (2) Look at 2200–2250 for C≡N. (3) Look at 1670–1750 for C=O, and 1500–1680 for C=C. (4) Check what is missing. Almost every organic spectrum has a C–H absorption near 2850–3100, so it does not tell you which compound you have.
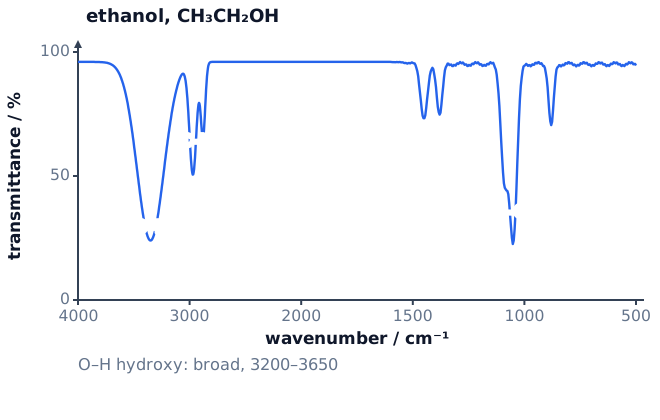
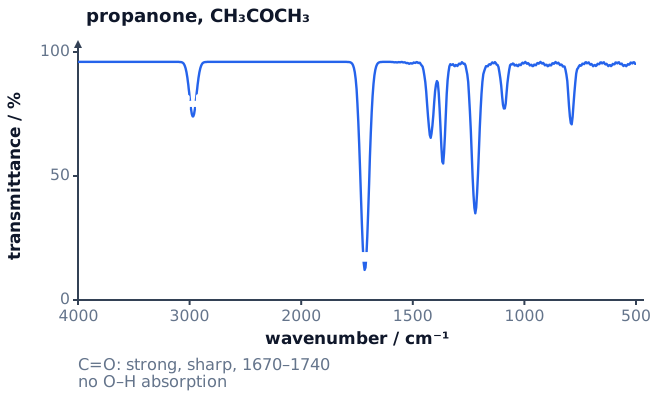
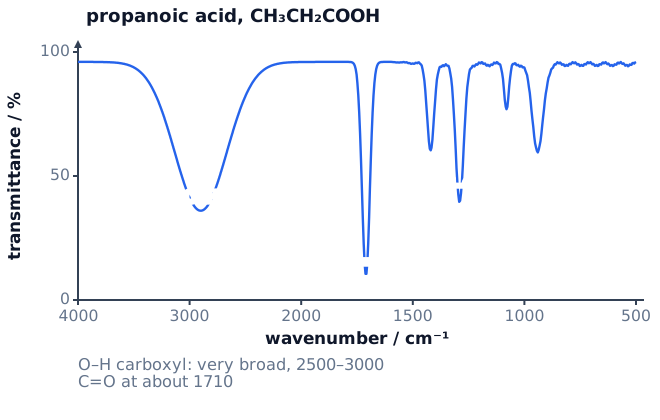
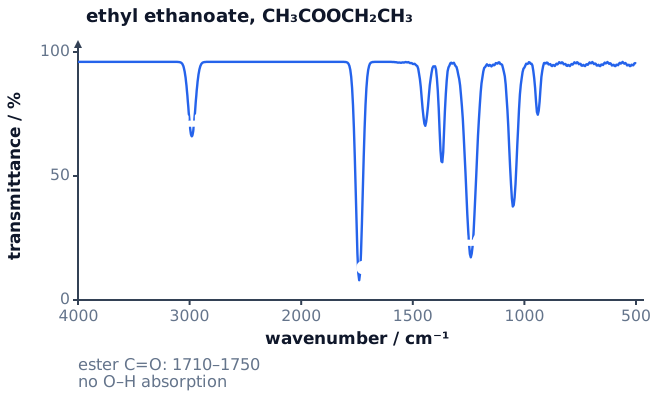
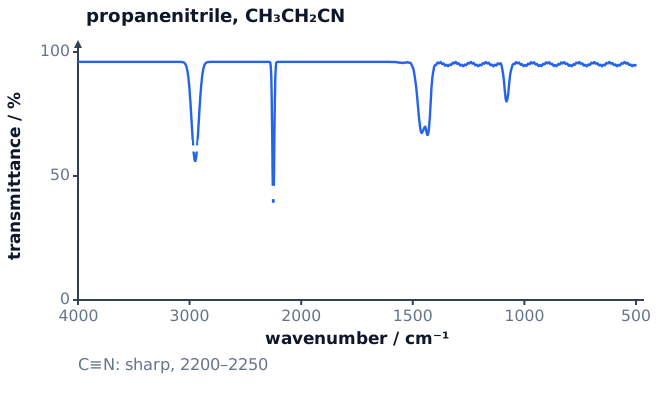
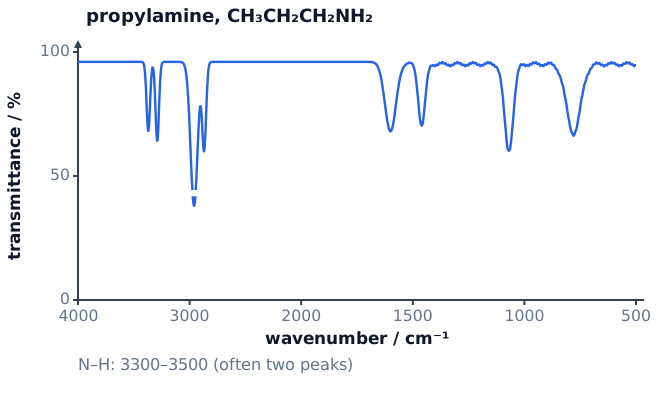
The same group, different compounds. A carboxylic acid and an ester both have C=O, but only the acid has the very broad O–H absorption at 2500–3000. Compare the three spectra above with the next one:

| Compound type | Look for | Look for the absence of |
|---|---|---|
| alcohol | broad O–H, 3200–3650; C–O, 1040–1300 | C=O |
| aldehyde or ketone | strong C=O, 1670–1740 | O–H |
| carboxylic acid | very broad O–H, 2500–3000; C=O, 1670–1740 | none: both present |
| ester | C=O, 1710–1750; C–O, 1040–1300 | O–H |
| nitrile | sharp C≡N, 2200–2250 | O–H, C=O |
| amine | N–H, 3300–3500 | C=O |
| alkene | C=C, 1500–1680 | O–H, C=O |
Spectra before and after a reaction. Infrared spectra show whether a reaction has worked. When propan-1-ol is oxidised to propanoic acid, the broad 3200–3650 absorption is replaced by the very broad 2500–3000 absorption and a new C=O absorption appears at about 1710. When an alkene is polymerised (Topic 20) the C=C absorption at 1500–1680 disappears. When a halogenoalkane is converted into a nitrile (Topic 19) a sharp C≡N absorption appears near 2250.
3. Mass Spectrometry
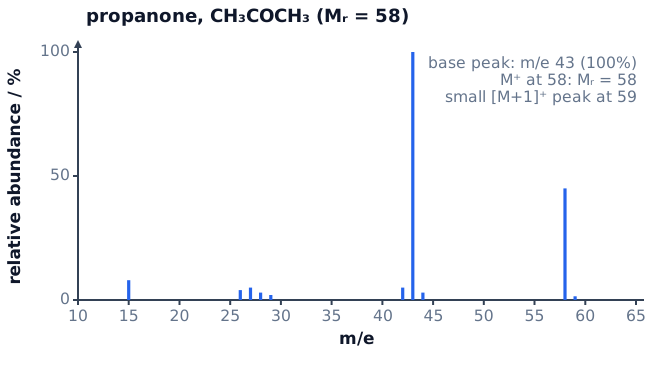
In a mass spectrometer the sample is ionised, and the positive ions are separated according to their mass-to-charge ratio, m/e. Almost every ion has a charge of 1+, so m/e is simply the mass of the ion on the carbon-12 scale. A mass spectrum is a bar chart of relative abundance (%) against m/e. You are not asked how the instrument works.
- The molecular ion, M+, is the molecule with one electron removed: CH3COCH3 → [CH3COCH3]+ + e−. Its m/e is the relative molecular mass, Mr, of the molecule made from the most abundant isotopes. It is normally the peak with the highest m/e apart from the small [M+1]+ and [M+2]+ peaks.
- The base peak is the tallest peak (100% relative abundance). It need not be the molecular ion.
- Fragment ions are formed when the molecular ion breaks apart. Only the positively charged pieces are detected; the neutral pieces are not.
4. Isotopes and Relative Atomic Mass
Atoms of an element with different numbers of neutrons are isotopes (Topic 1). A mass spectrum of an element shows one peak for each isotope: the m/e value is the isotopic mass and the height is the relative abundance. The relative atomic mass is the weighted average:
Ar = Σ(isotopic mass × abundance) / Σ(abundances)
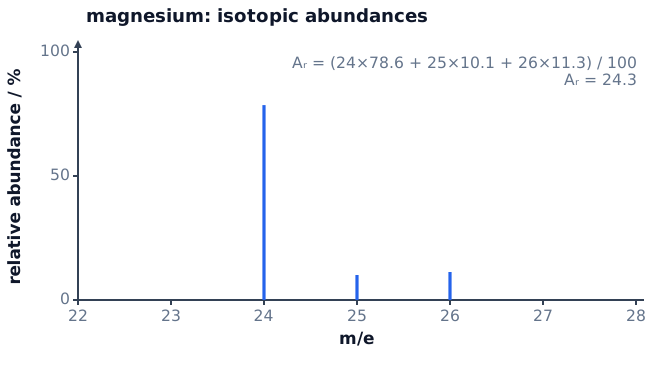
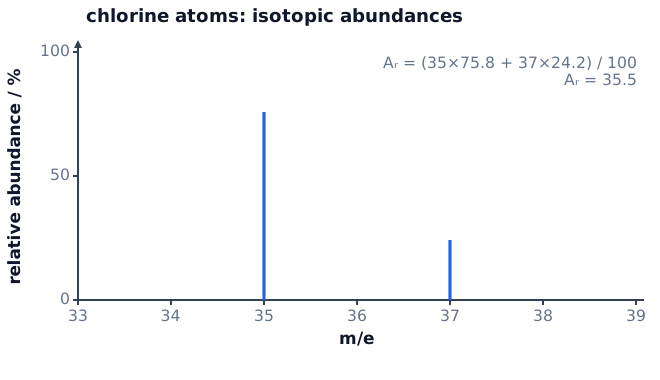
If the abundances are given as numbers that do not add to 100 (peak heights, for example), divide by their sum, not by 100. Isotopes have the same chemical properties because they have the same number of electrons, but different physical properties such as mass.
5. The [M+1] and [M+2] Peaks
The [M+1]+ peak and carbon. About 1.1% of carbon atoms are 13C. A molecule with n carbon atoms therefore has a small peak one unit above M+, whose height relative to M+ is about 1.1 × n %. Rearranged:
n = 100 × abundance of [M+1]+ / (1.1 × abundance of M+)
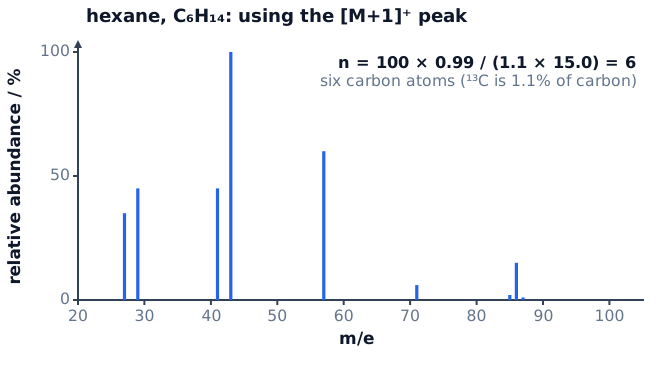
Worked example. M+ has abundance 9.0 and [M+1]+ has abundance 0.50. n = 100 × 0.50 / (1.1 × 9.0) = 5.05, so the compound has 5 carbon atoms. Always round to the nearest whole number and state it.
The [M+2]+ peak and halogens. Chlorine and bromine each have two common isotopes, so a compound containing one atom of either gives an M+ peak and an [M+2]+ peak, two mass units higher.
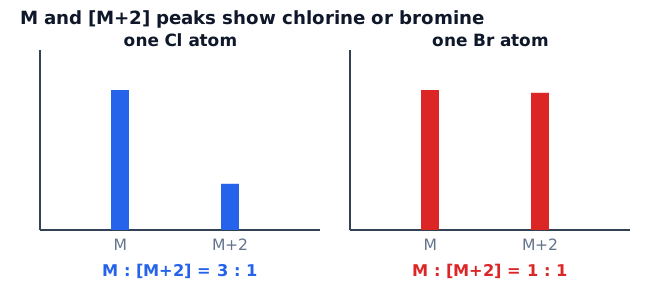
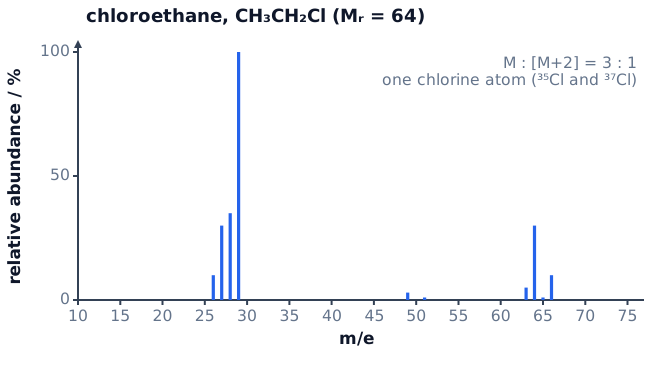
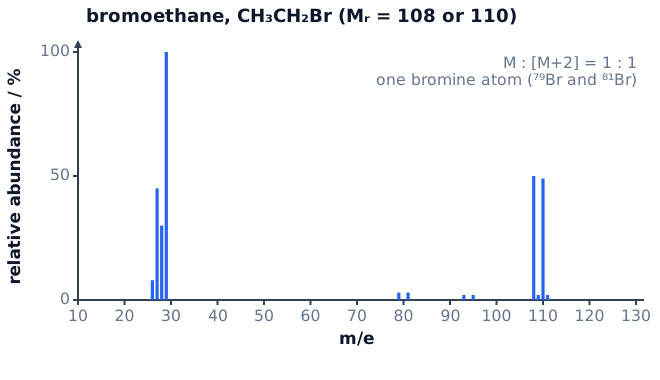
Worked example. A halogenoalkane has M+ peaks at m/e 122 and 124 of equal height. Equal height means one bromine atom. The molar mass of the rest of the molecule is 122 − 79 = 43, which is C3H7 (3 × 12.0 + 7 × 1.0 = 43.0). The compound is C3H7Br, 1-bromopropane or 2-bromopropane.
6. Fragmentation
The molecular ion is unstable and breaks at weak bonds or to give stable ions. Each fragment peak tells you the mass of a piece of the molecule. To assign a peak, subtract it from M+ to find what was lost, and match the m/e value to a formula.
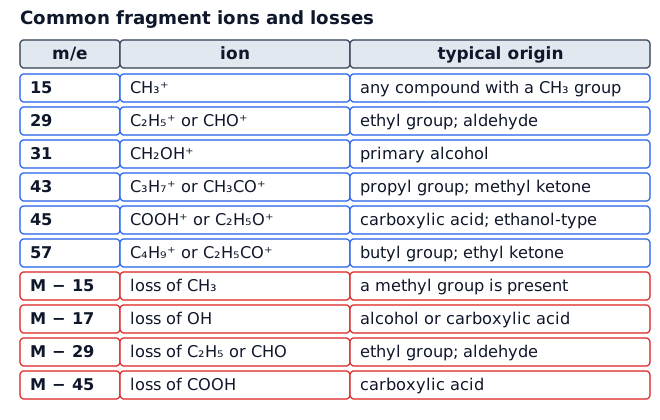
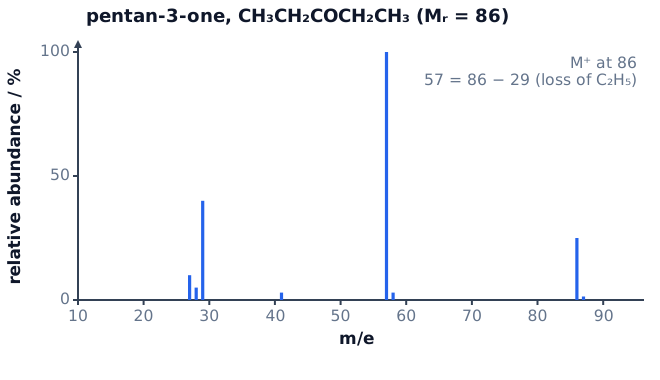
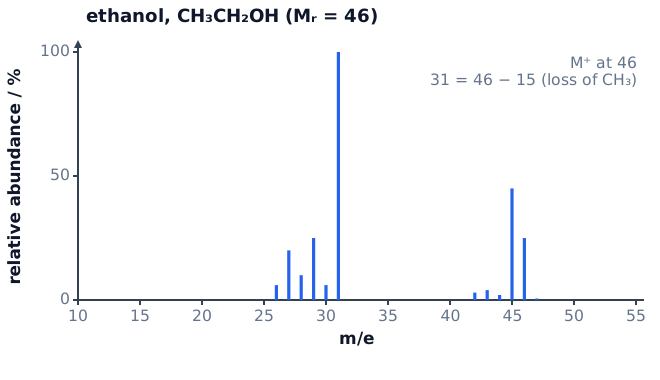
Worked example. A compound with Mr = 88 shows peaks at 43 and 45. A peak at 43 is CH3CO+ (or C3H7+) and 45 could be C2H5O+ or COOH+. The loss from M+ to 43 is 88 − 43 = 45, consistent with loss of OC2H5 from ethyl ethanoate, CH3COOCH2CH3 (Mr = 4 × 12.0 + 8 × 1.0 + 2 × 16.0 = 88.0).
7. Combining IR and Mass Spectra
Questions often give both spectra (and sometimes test results) and ask for the compound. The method is the same each time.
- M+ gives Mr. The [M+1]+ peak gives the number of carbons; an [M+2]+ peak shows Cl or Br.
- IR gives the functional group(s), including what is absent.
- Build a structure that fits the formula and the groups.
- Use a fragment peak or a test reaction to choose between isomers.
Worked example. Compound Q has M+ at m/e 74. M+ has abundance 15.0 and [M+1]+ has abundance 0.50, so n = 100 × 0.50 / (1.1 × 15.0) = 3.0: three carbons. The IR spectrum has a very broad absorption at 2500–3000 and a strong absorption at 1710. These show a carboxylic acid, so Q is CH3CH2COOH, propanoic acid, Mr = 3 × 12.0 + 6 × 1.0 + 2 × 16.0 = 74.0. Its isomer methyl ethanoate (also C3H6O2, Mr 74) has C=O but no broad O–H band, so the IR spectrum tells the two apart. Butan-1-ol (C4H10O, also Mr 74) has no C=O and a broad O–H at 3200–3650, and [M+1] would give four carbons.
8. Quick Sheet and Checklist
| Topic | Key point |
|---|---|
| IR principle | bonds absorb IR at characteristic wavenumbers (cm−1); transmittance dips show absorptions |
| O–H (alcohol) | 3200–3650, broad |
| O–H (carboxylic acid) | 2500–3000, very broad |
| N–H | 3300–3500 |
| C≡N | 2200–2250, sharp |
| C=O | 1670–1740 (carbonyl, carboxyl); 1710–1750 (ester); 1640–1690 (amide) |
| C=C | 1500–1680 |
| C–O | 1040–1300 |
| M+ | gives Mr; highest m/e apart from [M+1], [M+2] |
| Ar from isotopes | Σ(mass × abundance) / Σ(abundance) |
| Carbons | n = 100 × [M+1] / (1.1 × M) |
| Halogens | M : [M+2] = 3 : 1 is Cl; about 1 : 1 is Br |
| Fragments | M − 15 (CH3); 29 (C2H5+); 43 (CH3CO+); 45 (COOH+) |
| Not at AS | NMR, chromatography, how the instruments work |
Before you leave the question, check:
- Every IR peak is matched to a bond and a functional group, with the wavenumber range from the table.
- You have used what is absent from the spectrum as well as what is present.
- M+ is read from the molecular ion, not the base peak, and fragment ions are written with a + charge.
- The [M+1] calculation shows the substitution and is rounded to a whole number of carbons.
- A halogen is named from the ratio of M : [M+2] (3 : 1 or 1 : 1) and the isotopes are given.
- Ar calculations divide by the total abundance and agree with the Periodic Table value.
- The final structure fits the formula, the IR spectrum and the fragments.