 Score
Practical Skills 1: Paper 3
0. What Examiners Want
This guide covers the practical skills tested in Paper 3 (Advanced Practical Skills) of Cambridge International AS & A Level Chemistry 9701 (2025–27). The practical section of the syllabus lists the expectations for each skill rather than numbered learning outcomes, so the table below gives them word for word, grouped by skill. The right-hand column shows where each is taught. Paper 5 (planning, analysis and evaluation) is covered in the next unit.
| Paper 3 skill expectations. Candidates should be able to: | Section |
|---|---|
| Manipulation, measurement and observation (at least 12 marks) | |
| Successful collection of data and observations. Candidates should be able to: set up apparatus; follow instructions given in the form of written instructions or diagrams; use apparatus to collect an appropriate quantity of data; make observations, including subtle differences in colour, solubility or quantity of materials; make measurements using pipettes, burettes, measuring cylinders, thermometers and other common laboratory apparatus; candidates should record burette readings to the nearest 0.05 cm3 and, when using a thermometer calibrated at 1 °C intervals, temperature readings should be recorded to the nearest 0.5 °C | 1, 2, 3 |
| Quality of measurements or observations. Candidates should be able to: make accurate and consistent measurements and observations, including achieving concordant titres (two titres within 0.10 cm3 of each other) and precise colour descriptions | 2, 5 |
| Decisions relating to measurements or observations. Candidates should be able to: decide how many tests or observations to perform; make measurements that span a range and have a distribution appropriate to the experiment; identify where repeated readings or observations are appropriate; replicate readings or observations as necessary, including where an anomaly is suspected; identify where confirmatory tests are appropriate and the nature of such tests; select reagents to distinguish between given ions | 2, 3, 5 |
| Presentation of data and observations (at least 6 marks) | |
| Recording data and observations. Candidates should be able to: present numerical data, values or observations in a single table of results with headings and units that conform to accepted scientific conventions, i.e. volume / cm3, volume (cm3) or volume in cm3; record raw readings of a quantity to the same degree of precision; record observations to the same level of detail, using simple language such as ‘blue’ or ‘yellow’ and, where fine discrimination is required, terms such as ‘pale’ or ‘dark’ | 1, 2, 4, 5 |
| Display of calculation and reasoning. Candidates should be able to: show working in calculations and key steps in reasoning; use the correct number of significant figures for calculated quantities (the same as, or one more than, the smallest number of significant figures in the provided or experimentally determined data) | 2, 3 |
| Data layout. Candidates should be able to: present data in a single table of results; draw an appropriate table in advance of taking readings; record all data in the table; plot appropriate variables on appropriate, clearly labelled x- and y-axes; choose scales such as 1, 2 or 5 units to a 20 mm square so that the points occupy at least half of the grid in both directions; plot all points using a cross × or circled dot to an appropriate accuracy; draw straight lines or smooth curves of best fit with an even distribution of points on either side, identifying anomalous points | 4 |
| Analysis, conclusions and evaluation (at least 10 marks) | |
| Interpretation of data or observations. Candidates should be able to: describe the patterns and trends shown by data in tables and graphs; describe and summarise the key points of a set of observations; calculate quantities from data, or calculate the mean from repeated values; find an unknown value by using coordinates, a point of intersection or intercepts on a graph; determine the gradient of a straight-line graph, using two points that are more than half of the length of the axes apart; extrapolate the line of a graph | 2, 3, 4 |
| Drawing conclusions. Candidates should be able to: draw conclusions from an experiment, considering whether experimental data support a given hypothesis, and making further predictions; draw conclusions from interpretations of observations, data and calculated values; make scientific explanations of data, observations and conclusions that they have described | 3, 5, 6 |
| Identifying sources of error and suggesting improvements. Candidates should be able to: evaluate the effectiveness of control variables; comment on errors intrinsic in measuring devices and in the limitations of the method; show an understanding of the distinction between systematic errors and random errors; identify the most significant sources of error in an experiment; state the uncertainty in a quantitative measurement and express it as an actual or percentage error; suggest realistic modifications that will improve the accuracy of the experiment or the observations; suggest ways in which to extend the investigation to answer a new question | 6 |
| Practical procedures | |
| Quantitative analysis: titration experiments (acid–alkali with the indicators listed in the syllabus; potassium manganate(VII) with hydrogen peroxide, iron(II) ions or ethanedioic acid or its salts; sodium thiosulfate and iodine); rates experiments; gravimetric experiments; thermometric experiments; gas volume experiments | 2, 3 |
| Qualitative analysis: carrying out and interpreting tests for the cations, anions and gases in the Qualitative analysis notes, and the organic tests for aldehydes, CH3CO– or CH3CH(OH)– groups and oxidisable compounds | 5 |
- Measurement: readings to the precision of the instrument, results close to the Supervisor’s values, and concordant titres.
- Observation: every test recorded in plain words, including ‘no change’, with fine colour differences described.
- Presentation: a table drawn before the readings, with headings and units, and a graph with labelled axes, a sensible scale and a ruled line.
- Calculation: each step shown, the right number of significant figures, and units on every answer.
- Conclusion: an identification or a decision that follows from the data, supported by one piece of evidence.
- Evaluation: the main source of error named precisely, its size as a percentage where asked, and a realistic improvement.
1. The Paper and Its Measurements
Paper 3 is a two-hour laboratory examination worth 40 marks. You use real apparatus, record your own results and answer on the question paper. The Qualitative analysis notes, the Periodic Table and the key constants are printed in the paper, so you do not need to memorise them, but you need to know them well enough to use them quickly.
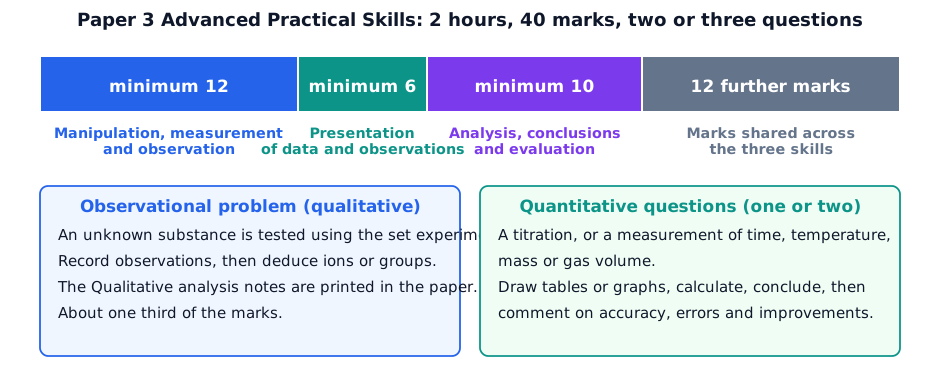
Planning your time. Read the whole method before you start. Draw each results table before taking readings, so that nothing needs to be copied out later. Start any slow step (such as a solution standing) first. Two or three questions share two hours, so allow about 35 to 40 minutes for each quantitative question and about 40 minutes for the qualitative one.
Reading apparatus. Cambridge expects you to read to the precision of the instrument. The rule is half the smallest division when you must estimate between marks, and the printed precision for a digital instrument such as a balance.
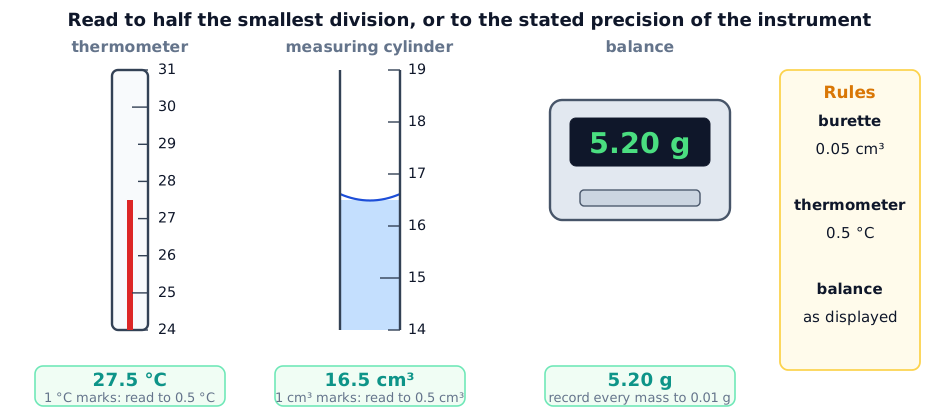
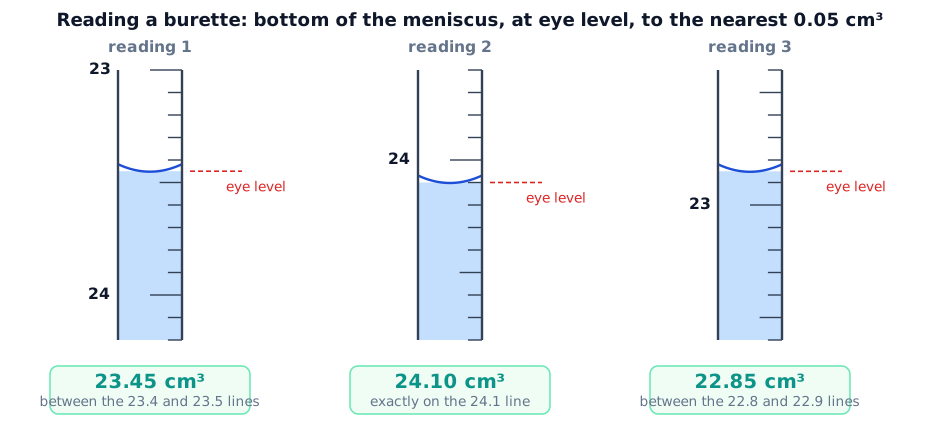
A burette is marked every 0.1 cm3. You read the bottom of the meniscus with your eye level with it, and record to the nearest 0.05 cm3, which means the second decimal place is always 0 or 5.
| Instrument | Smallest division | Record to | Maximum uncertainty of one reading |
|---|---|---|---|
| burette | 0.1 cm3 | 0.05 cm3 (e.g. 23.45) | ±0.05 cm3 |
| thermometer, 1 °C marks | 1 °C | 0.5 °C (e.g. 27.5) | ±0.5 °C |
| measuring cylinder, 1 cm3 marks | 1 cm3 | 0.5 cm3 | ±0.5 cm3 |
| balance reading to 0.01 g | 0.01 g | 0.01 g (e.g. 5.20) | ±0.005 g |
| stopwatch | as displayed | as displayed (e.g. 47 s) | depends on reaction timing |
What is given to you. The method may refer to solutions as FA 1, FA 2 and so on. Treat every unknown with caution, add only the volume specified and record all observations. If you cannot set up the apparatus, the Supervisor may help, but marks for collecting data may then be reduced.
2. Titrations
A titration finds the concentration of one solution by reacting a measured volume of it with a solution of known concentration. Cambridge expects you to be able to carry out acid–alkali titrations, potassium manganate(VII) titrations and sodium thiosulfate with iodine titrations, and to follow the same technique every time.
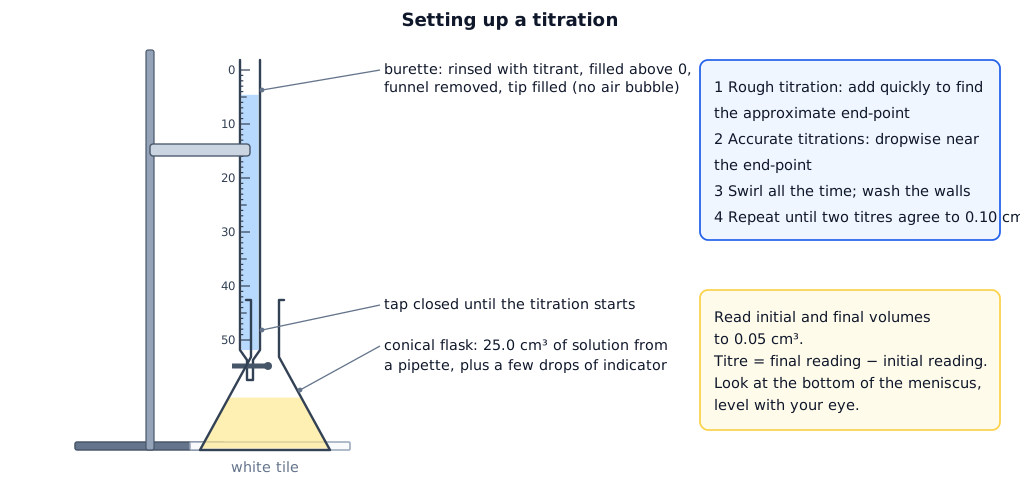
Technique and the marks it earns.
- Rinse the burette with the titrant and the pipette with the solution it will deliver. Rinse the conical flask with distilled water only.
- Fill the burette above the zero mark, run some out to fill the tip, and record the starting reading.
- Use a pipette to measure the solution in the flask (25.0 cm3) and add a few drops of indicator. Place the flask on a white tile.
- Carry out a rough titration first to find the approximate end-point. Then repeat accurately, adding the titrant dropwise within about 2 cm3 of the end-point.
- Repeat until you have concordant titres: two titres within 0.10 cm3 of each other.
Recording the results. Use a single table with headings and units. Do not include the rough titration in the mean.
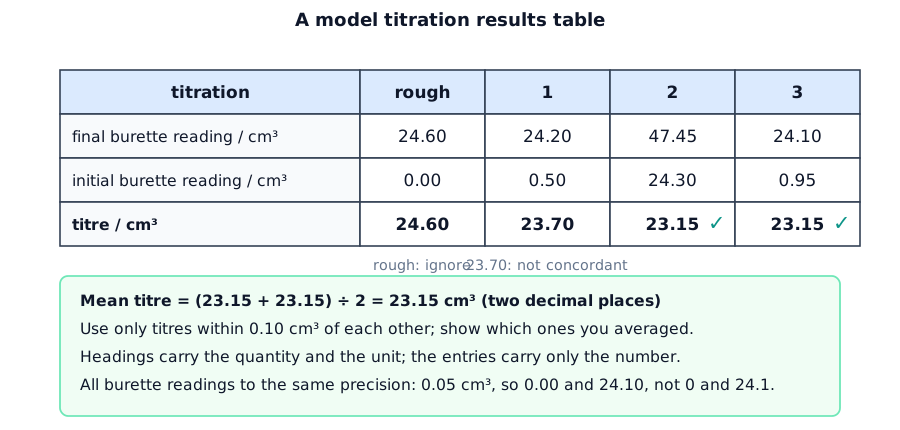
When a result is far from the others, repeat it. If three titres are 23.70, 23.15 and 23.15, use the two that agree. If none agree within 0.10 cm3, the mean of the closest pair is acceptable only if you state it, but you will lose the mark for concordance.
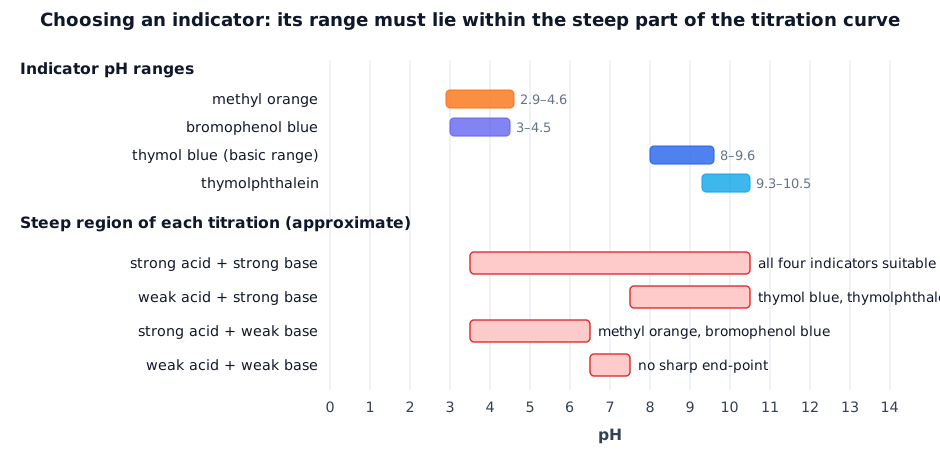
Indicators. The pH range of the indicator must fall within the steep part of the titration curve, so that one drop changes the colour sharply.
| Titration | Equation or ratio | End-point colour change |
|---|---|---|
| acid with alkali | e.g. HCl + NaOH 1 : 1; H2SO4 + 2NaOH 1 : 2 | depends on the indicator (methyl orange: red to yellow in acid-to-alkali titrations) |
| MnO4− with Fe2+ | MnO4− + 8H+ + 5Fe2+ → Mn2+ + 4H2O + 5Fe3+ (1 : 5) | colourless to the first permanent pale pink |
| MnO4− with H2O2 | 2MnO4− + 6H+ + 5H2O2 → 2Mn2+ + 8H2O + 5O2 (2 : 5) | colourless to pale pink |
| MnO4− with ethanedioate | 2MnO4− + 16H+ + 5C2O42− → 2Mn2+ + 8H2O + 10CO2 (2 : 5), warmed to about 60 °C | colourless to pale pink |
| I2 with S2O32− | I2 + 2S2O32− → 2I− + S4O62− (1 : 2) | brown or yellow to pale yellow; add starch near the end; blue-black to colourless |
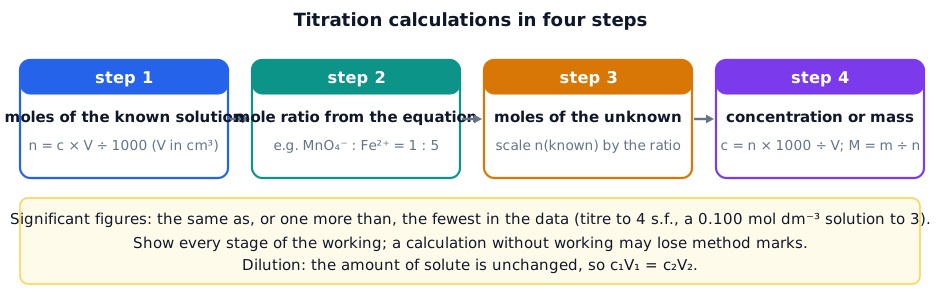
Calculations. Always follow the same four steps.
Worked example. In a titration, 25.0 cm3 of an acidified solution of iron(II) sulfate required a mean titre of 23.15 cm3 of 0.0200 mol dm−3 potassium manganate(VII). Calculate the concentration of the iron(II) solution. [3]
Step 1. Moles of MnO4− = 0.0200 × 23.15 ÷ 1000 = 4.630 × 10⁻⁴ mol [1]. Step 2. The ratio is MnO4− : Fe2+ = 1 : 5, so moles of Fe2+ = 5 × 4.630 × 10−4 = 2.315 × 10⁻³ mol [1]. Step 3. Concentration = 2.315 × 10−3 × 1000 ÷ 25.0 = 0.0926 mol dm−3 [1]. The titre has four significant figures and the concentration of manganate(VII) has three, so three or four significant figures are acceptable.
Worked example. A student titrates 25.0 cm3 of aqueous iodine with sodium thiosulfate, 0.100 mol dm−3. The mean titre is 20.00 cm3. Calculate the concentration of the iodine. [3]
Moles S2O32− = 0.100 × 20.00 ÷ 1000 = 2.00 × 10⁻³ mol [1]. Ratio I2 : S2O32− = 1 : 2, so moles I2 = 1.00 × 10⁻³ mol [1]. Concentration = 1.00 × 10−3 × 1000 ÷ 25.0 = 0.0400 mol dm−3 [1].
3. Thermometric, Rate, Gravimetric and Gas Methods
The syllabus names five types of quantitative experiment. Titration is the first. The other four are each built on one measured quantity and one calculation.
3.1 Thermometric experiments
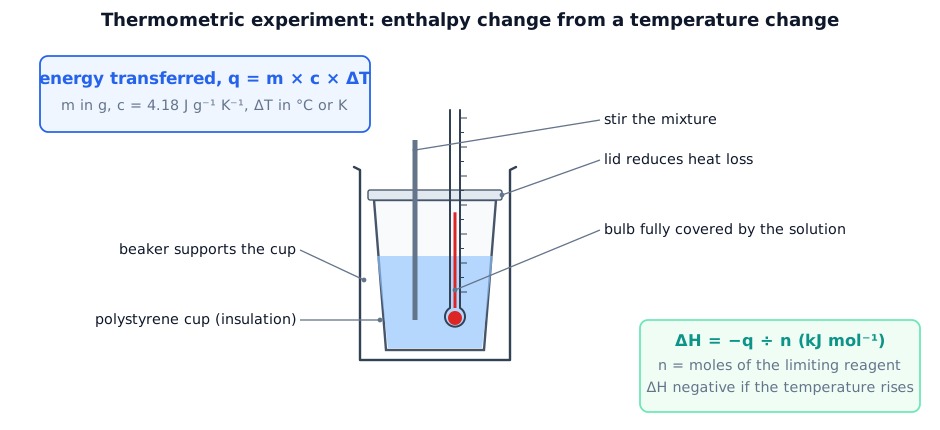
Measure the initial temperature of the solutions (or of one, if they start at room temperature), mix, stir and record the maximum or minimum temperature. Calculate the temperature change, then the energy transferred.
Worked example. 25.0 cm3 of 2.00 mol dm−3 hydrochloric acid and 25.0 cm3 of 2.00 mol dm−3 sodium hydroxide, both at 21.0 °C, are mixed in a polystyrene cup. The maximum temperature is 34.5 °C. Calculate ΔH for the neutralisation, and the maximum percentage error in the temperature change. [4]
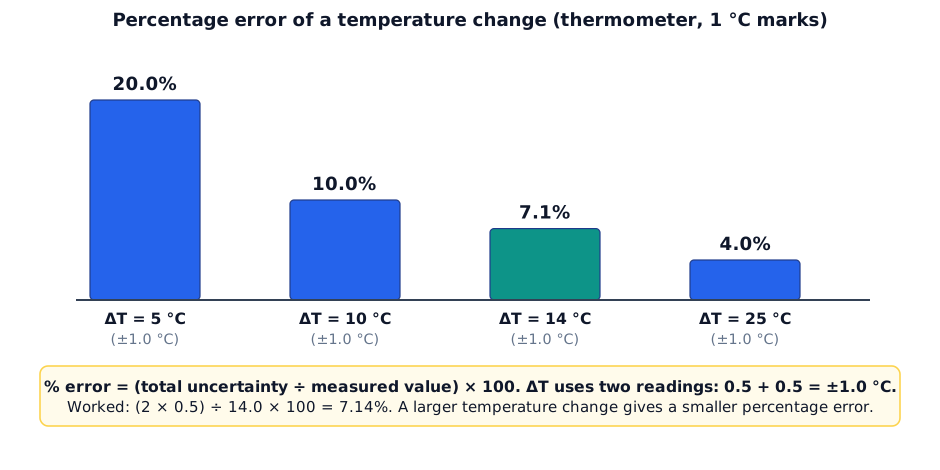
ΔT = 34.5 − 21.0 = 13.5 °C. Energy transferred q = m × c × ΔT = 50 × 4.18 × 13.5 = 2822 J [1]. Moles of HCl = 2.00 × 25.0 ÷ 1000 = 0.0500 mol [1]. ΔH = −2822 ÷ 0.0500 = −56 440 J mol−1 = −56.4 kJ mol−1 [1]. The sign is negative because the temperature rose. Maximum percentage error in ΔT = (2 × 0.5) ÷ 13.5 × 100 = 7.41% [1].
If the reaction is slow or heat is lost, record the temperature at regular intervals and plot a graph. The maximum temperature is then found by extrapolating the cooling line back to the time of mixing. Section 4 explains this, and Paper 5 uses it again.
3.2 Rate experiments
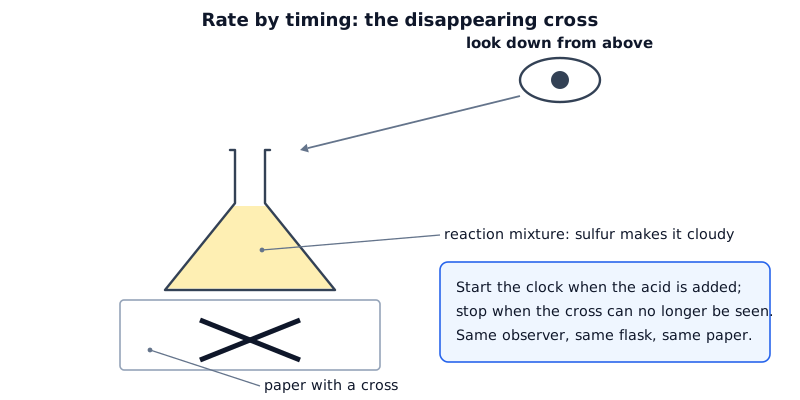
Mix sodium thiosulfate with hydrochloric acid in a flask over a cross, start the clock when the acid is added, and stop it when the cross can no longer be seen. The rate is proportional to 1 ÷ t. Change one variable at a time (concentration of thiosulfate, or temperature) and keep every other variable the same, including the total volume and the observer. Because the end-point is a judgement, this is a source of random error.
3.3 Gravimetric experiments

A typical experiment is the determination of the water of crystallisation of a hydrated salt. Weigh the empty crucible, add the salt, weigh, heat gently then strongly, cool and weigh. Repeat the heating until the mass is constant. Do not allow the solid to spit out of the crucible.
Worked example. A crucible has a mass of 21.36 g. With hydrated copper(II) sulfate, CuSO4•xH2O, the mass is 23.86 g. After heating to constant mass the crucible and solid have a mass of 22.96 g. Calculate x. [4]
Mass of hydrate = 23.86 − 21.36 = 2.50 g. Mass of anhydrous CuSO4 = 22.96 − 21.36 = 1.60 g, so mass of water = 2.50 − 1.60 = 0.90 g [1]. Moles of CuSO4 = 1.60 ÷ 159.6 = 0.01003 mol [1]. Moles of H2O = 0.90 ÷ 18.0 = 0.0500 mol [1]. x = 0.0500 ÷ 0.01003 = 4.99, so x = 5 [1].
3.4 Gas volume experiments

React a known mass of a carbonate with excess acid, collect the carbon dioxide and read its volume. Add the solid last and replace the bung immediately, otherwise some gas escapes before the clock or the syringe is ready. Convert volume to moles using 24.0 dm3 mol−1 at room conditions, which the Data Booklet gives.
Worked example. A 0.250 g sample of impure calcium carbonate reacts with excess hydrochloric acid and gives 52.0 cm3 of carbon dioxide at room conditions. Calculate the percentage purity. [4]
Moles of CO2 = 52.0 ÷ 24 000 = 2.167 × 10⁻³ mol [1]. CaCO3 + 2HCl → CaCl2 + H2O + CO2, so moles of CaCO3 = 2.167 × 10⁻³ mol [1]. Mass = 2.167 × 10−3 × 100.1 = 0.2169 g [1]. Purity = 0.2169 ÷ 0.250 × 100 = 86.8% [1].
4. Tables and Graphs
Tables. Draw the table before you start. Give each column a heading in the form quantity / unit, for example time / s or temperature / °C. Put only numbers in the body. Give all readings of one quantity to the same number of decimal places. The independent variable is in the first column.
Graphs. Marks are awarded for the axes, the scale, the points, the line and (when asked) the use of it.
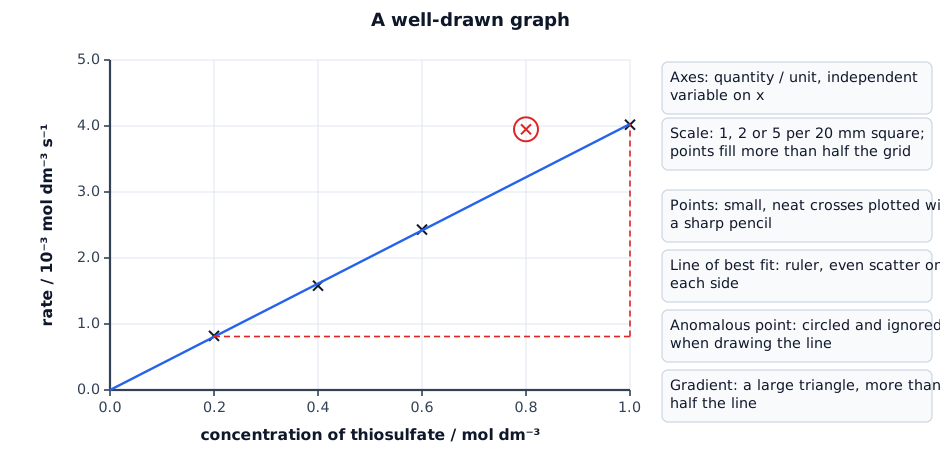
| Feature | What is expected |
|---|---|
| axes | independent variable on the x-axis; label as quantity / unit |
| scale | 1, 2 or 5 (or multiples of 10) units to a 20 mm square; no awkward scales such as 3 or 7; the points use more than half the grid in both directions |
| points | a small cross (×) or a circled dot, plotted to within half a small square |
| line | a sharp pencil; a straight line with a ruler, or a smooth curve; about the same number of points above and below it |
| anomaly | circle it, state that it is anomalous, and ignore it when drawing the line |
| gradient | a right-angled triangle that covers more than half of the line, with the coordinates read from the line and not from the table |
| intercept or extrapolation | extend the line to the axis, dashed, and read the value |
Using the graph. The gradient is the change in y divided by the change in x, with units. For a rate graph of 1 ÷ t against concentration, a straight line through the origin shows that the rate is directly proportional to concentration (first order with respect to that reagent). An intercept or the intersection of two lines gives a value that is not measured directly, such as the volume at the end-point of a thermometric titration. An extrapolation is used to find a temperature at a time when it could not be measured.
Worked example. A student plots 1 ÷ t (in 10−3 s−1) against the concentration of sodium thiosulfate. A straight line passes through the origin and through the point (0.100, 50.0). Calculate its gradient, and state what it shows. [3]
Gradient = (50.0 − 0) × 10−3 ÷ (0.100 − 0) = 0.500 dm3 mol−1 s−1 [2: value, units]. The line is straight and passes through the origin, so the rate is directly proportional to the concentration of thiosulfate [1].
5. Qualitative Analysis
One question gives you unknown substances, labelled FA 1 and so on, and a set of tests. You record observations, then use the Qualitative analysis notes printed in the paper to identify cations, anions and gases. Notes for the paper: do not carry out tests the method does not ask for, add only the volume specified (about 1 cm depth in a test-tube), and use a boiling tube to warm a solution and a hard-glass tube to heat a solid.
Observation language. Write what you see. Use simple terms: colourless solution, white ppt., effervescence, pale blue, dark green. Use ‘ppt.’ for precipitate. State when a ppt. dissolves in excess or does not dissolve, and whether the change is on standing. If nothing happens, write no change or no ppt.
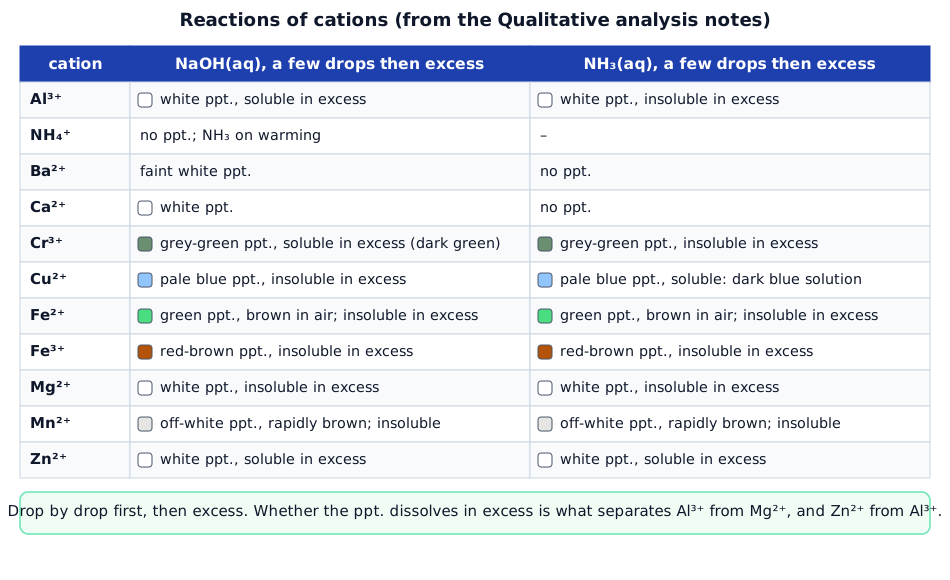
Making the cation decision. First look at the colour of the solution and the ppt. Coloured ppt.: Cu2+ (pale blue), Fe2+ (green, turning brown), Fe3+ (red-brown), Cr3+ (grey-green), Mn2+ (off-white, turning brown). White ppt.: use the excess test. A white ppt. that dissolves in excess NaOH is Al3+ or Zn2+; in excess NH3, Al3+ does not dissolve but Zn2+ does. A white ppt. that does not dissolve in excess is Mg2+ (ppt. with NH3 as well) or Ca2+ (no ppt. with NH3). A faint white ppt. with NaOH and none with NH3 is Ba2+. If there is no ppt. with NaOH, warm; ammonia gas turning damp red litmus blue shows NH4+.
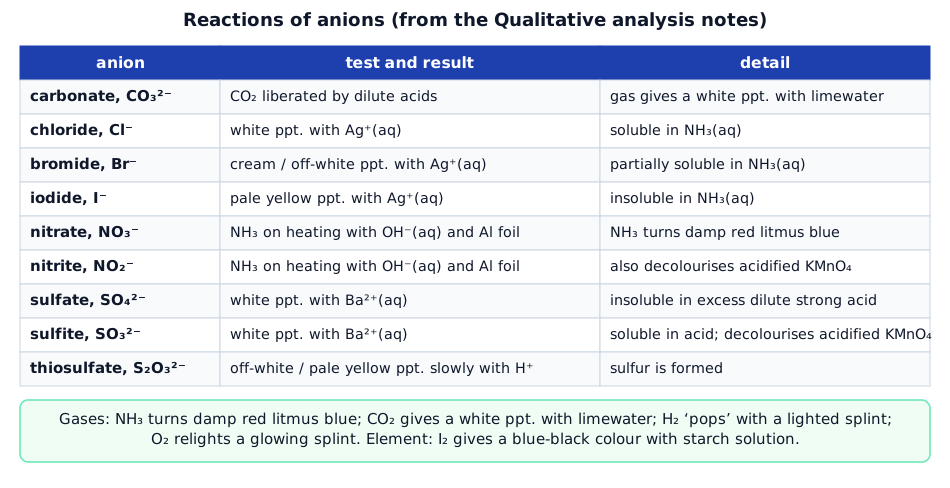
Making the anion decision. Add dilute acid first: effervescence of CO2 (limewater turns milky) shows carbonate; a pale yellow ppt. forming slowly shows thiosulfate. To separate the halides use silver nitrate, then ammonia: white and soluble is chloride, cream and partly soluble is bromide, pale yellow and insoluble is iodide. Barium ions give a white ppt. with sulfate (insoluble in acid) and sulfite (dissolves in acid). For nitrate and nitrite warm with NaOH and aluminium foil: ammonia gas turns damp red litmus blue. Acidified manganate(VII) is decolourised by nitrite (not nitrate) and by sulfite.
| Organic test (Paper 3) | Positive result | What it shows |
|---|---|---|
| Fehling’s reagent, warm | orange / red ppt. | aldehyde (a ketone gives no change) |
| Tollens’ reagent, warm | silver mirror or black ppt. | aldehyde |
| alkaline aqueous iodine, warm | yellow ppt. | CH3CO– or CH3CH(OH)– group |
| acidified KMnO4, warm | purple to colourless | a compound that can be oxidised (alcohol, aldehyde, alkene) |
Worked example. Solution FA 1 gives a white ppt. with NaOH(aq) that dissolves in excess, and a white ppt. with NH3(aq) that does not dissolve in excess. A second sample gives a white ppt. with Ba2+(aq) that remains when dilute nitric acid is added. Identify the ions in FA 1. [4]
White ppt. with NaOH that dissolves in excess is Al3+ or Zn2+ [1]. The white ppt. with NH3 that does not dissolve in excess shows Al3+ (Zn2+ would dissolve) [1]. A white ppt. with Ba2+ that is insoluble in acid shows SO42− [1]. FA 1 is aluminium sulfate, Al2(SO4)3 [1].
Confirmatory tests and decisions. Cambridge awards marks for choosing a reagent that distinguishes two possibilities. To separate Al3+ from Zn2+ add excess NH3. To separate Mg2+ from Ca2+ use NH3. To separate Cl− from Br− from I− use Ag+ then NH3. To separate SO42− from SO32− add acid to the ppt. or use acidified KMnO4.
6. Analysis, Errors and Evaluation
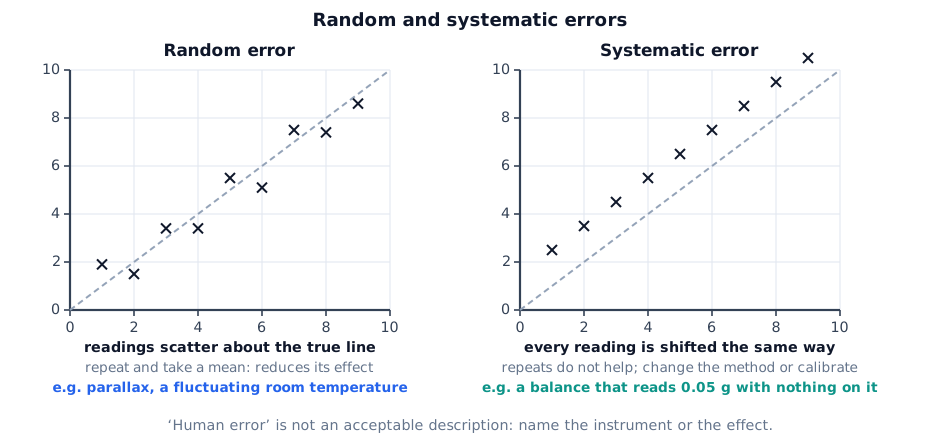
Systematic and random errors. A systematic error shifts every reading in the same direction, for example a balance with a zero error, so using the same balance for every weighing cancels it in a difference. A random error varies unpredictably, for example a change in room temperature or judging the end of the disappearing cross, and repeated readings with a mean reduce it.
Uncertainty and percentage error. The maximum uncertainty of one reading is half the smallest division. Percentage error = uncertainty ÷ measured value × 100. For a difference (a titre, a temperature change), add the uncertainties of the two readings.
Worked example. A burette is read before and after a titration. The titre is 23.15 cm3. Calculate the maximum percentage error in the titre. [2]
Uncertainty in the titre = 0.05 + 0.05 = ±0.10 cm3 [1]. Percentage error = 0.10 ÷ 23.15 × 100 = 0.43% [1].
Worked example. In the gravimetric experiment in Section 3 the balance reads to 0.01 g. Calculate the maximum percentage error in the 2.50 g mass of hydrate, which is found as a difference of two weighings. [2]
Uncertainty = 0.005 + 0.005 = ±0.01 g [1]. Percentage error = 0.01 ÷ 2.50 × 100 = 0.40% [1].
Suggesting improvements. A good answer links the error to a change and to its effect. Choose the largest source of error first.
| Source of error | Improvement | Why it helps |
|---|---|---|
| heat lost in a thermometric experiment | use a lid and a polystyrene cup; plot a cooling curve and extrapolate | reduces heat loss; finds the maximum temperature at the time of mixing |
| a small temperature rise measured on a thermometer with 1 °C marks | use more concentrated solutions or a larger mass of solid, or a thermometer reading to 0.1 °C | a larger ΔT gives a smaller percentage error |
| reaction too slow to see the end-point | use a colorimeter or a data logger | removes the judgement of the observer |
| gas lost before the syringe is attached | add the solid last and replace the bung immediately; use a tube to hold the solid | all the gas is collected |
| crucible not constant in mass | heat to constant mass and cool in a desiccator | all the water is lost and none is regained |
| few repeats | repeat the experiment and use a mean; check for anomalies | reduces the effect of random errors |
| burette reading error of ±0.05 cm3 | use a larger titre (a more dilute titrant or a bigger sample) | a larger volume gives a smaller percentage error |
Drawing conclusions. State the finding in terms of the data (‘the rate doubles when the concentration doubles’) and then give the chemical reason from the theory. When a hypothesis is given, say whether the data support it and quote one piece of evidence.
7. Quick Sheet and Checklist
| Topic | What to remember |
|---|---|
| precision | burette 0.05 cm3; thermometer 0.5 °C; mass as the balance shows; one precision for each quantity |
| titration | rinse, rough first, dropwise near the end-point, concordant within 0.10 cm3, mean of concordant titres |
| ratios | MnO4− : Fe2+ 1 : 5; MnO4− : H2O2 2 : 5; MnO4− : C2O42− 2 : 5; I2 : S2O32− 1 : 2 |
| thermometric | q = mcΔT; ΔH = −q ÷ n; ΔT uncertainty ±1.0 °C |
| gravimetric | heat to constant mass (within 0.01 g); x = moles water ÷ moles salt |
| gas volume | 24.0 dm3 mol−1 at room conditions; syringe 100 cm3 |
| graph | axes labelled, scale over half the grid, crosses, ruled line, big gradient triangle |
| qualitative | a few drops, then excess; record ‘no change’; observation first, conclusion last |
| errors | systematic and random; % error = uncertainty ÷ value × 100; no ‘human error’ |
- [ ] I can read a burette, thermometer, cylinder and balance to the correct precision and record every reading in a table that I drew first.
- [ ] I can carry out a titration with a rough and accurate runs, identify concordant titres and calculate a mean.
- [ ] I can calculate concentration, mass or Mr from a titre, with the mole ratio stated and the right number of significant figures.
- [ ] I can find ΔH, the formula of a hydrated salt, a purity or a rate from thermometric, gravimetric, gas-volume and rate data.
- [ ] I can draw a graph with labelled axes, a good scale, plotted crosses and a ruled line, and find a gradient, an intercept or an intersection.
- [ ] I can identify the cations, anions and gases in the Qualitative analysis notes and choose a reagent that distinguishes two ions.
- [ ] I can state the uncertainty of a reading, calculate a percentage error, distinguish random from systematic errors and suggest a specific improvement.