 Score
Practical Skills 2: Paper 5
0. What Examiners Want
This guide covers the skills tested in Paper 5 (Planning, Analysis and Evaluation) of Cambridge International AS & A Level Chemistry 9701 (2025–27). The practical section of the syllabus lists expectations for each skill, so the table below gives them word for word, grouped by skill, with the section where each is taught. It builds on Paper 3 (previous unit), where the measurements and graph conventions are set out.
| Paper 5 skill expectations. Candidates should be able to: | Section |
|---|---|
| Planning: defining the problem (together with Method, at least 12 marks) | |
| Candidates should be able to: identify a safe and efficient procedure that when followed would lead to a reliable result; identify the steps necessary to carry out the procedure; identify apparatus that is suitable for carrying out each step of the procedure; show an understanding of the risks of a proposed experiment; identify the independent variable in an experiment; identify the dependent variable in an experiment; express the aim of an experiment in terms of a prediction, and express this in words or in the form of a predicted graph; identify any variables that are to be controlled; show an understanding of how and why the procedure suggested will be effective | 1, 2 |
| Planning: method | |
| Candidates should be able to: describe the method to be used when carrying out the experiment to its full conclusion, including, as appropriate, preparation of results tables, proposed graphs to plot, key points to consider in any evaluation of the method and results, and reference back to the prediction; describe the arrangement of apparatus, by use of words or labelled diagrams, and the steps in the procedure to be followed in order to collect all relevant data; suggest the use of appropriate measuring instruments so that the data are recorded to a suitable precision; suggest appropriate volumes and concentrations of reagents | 2 |
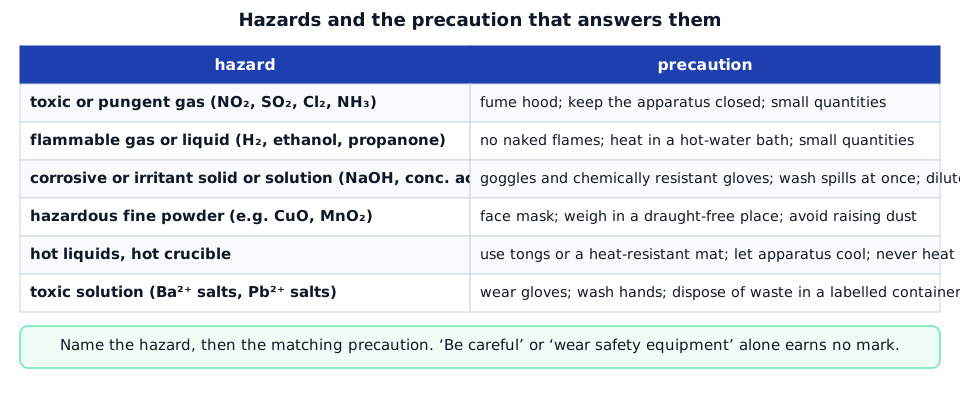
| Candidates should be able to: describe precautions that should be taken to keep risks to a minimum, including use of a fume hood for hazardous gases, use of a face mask for hazardous particles, avoidance of naked flames for flammable materials and wearing chemically resistant gloves for handling irritant materials; describe how to vary the independent variable and how the dependent variable is to be measured, and describe how each of the other key variables might be controlled; explain how any control experiments might be used to verify that it is the independent variable that is affecting the dependent variable and not some other factor; describe the outcome of steps in the procedure where these are relevant to the overall experiment | 1, 2 |
| Candidates should be able to: draw up appropriately headed tables for data to be recorded and describe how the data might be used in order to reach a conclusion; describe standard laboratory practice when carrying out quantitative determinations, e.g. making up of standard solutions, weighing by difference, concordancy of titrations, heating to constant mass, taking more readings about the inflexion point of a plot of data values | 2 |
| Analysis, conclusions and evaluation: dealing with data (at least 12 marks with Conclusion and Evaluation) | |
| Candidates should be able to: identify the calculations and means of presentation of data that are necessary to be able to draw conclusions from provided data; use calculations to enable simplification or explanation of data, including calculation of mean, percentage and percentage gain or loss; use tables and graphs to draw attention to the key points in quantitative data, including the variability of data; analyse data to draw appropriate conclusions; plot an appropriate graph from provided or calculated data fulfilling the criteria for plotting detailed in the Paper 3 section; plot a graph of y against x and use the graph to find the values of m and c in an equation of the form y = mx + c; suggest appropriate axes from a range of data values; calculate the percentage error of a measurement; calculate quantities from raw data; use the correct number of significant figures for these calculated quantities | 3 |
| Conclusion | |
| Candidates should be able to: draw a conclusion from an investigation, providing a detailed description of the key features of the data and analyses, and considering whether experimental data support the conclusion reached; make detailed scientific explanations of the data, analyses and conclusion described; make further predictions and suggest improvements; conclude whether errors in experimentally obtained data could be accounted for by a measurement error or by other factors | 5 |
| Evaluation | |
| Candidates should be able to: identify anomalous values in provided data, suggest possible explanations for anomalous readings and suggest appropriate means of dealing with such anomalies; identify the extent to which provided readings have been adequately replicated and the benefit of this; describe the adequacy of the range of data provided; use provided information to assess the extent to which selected variables have been effectively controlled; identify and explain the weaknesses of the experimental procedure used; suggest and explain the effect that a change in the concentrations of reagents or the conditions used for the experiment might have on the results obtained; suggest the consequences that the incorrect use of apparatus might have on the results obtained | 4 |
| Candidates should be able to: explain that data that obey a line of best fit are reliable because there are no anomalous points; comment on the validity of data with regards to their suitability to prove or disprove a prediction; identify instances where additional readings being taken during the experiment would be advantageous in order to give a more comprehensive range of values; draw together all available information to make judgements about the reliability of the investigation and the trustworthiness of its outcomes; comment on the quality of data and state whether or not the data support a prediction; use evaluations and provided information to make informed judgements on the confidence with which conclusions may be drawn | 4, 5 |
- Defining the problem: a prediction with its reason, and the independent, dependent and controlled variables named.
- Method: quantities, apparatus and steps in order; the independent variable changed accurately; the dependent variable measured with a suitable instrument; repeats; a results table; and how the data lead to a conclusion.
- Safety: the specific hazard and the matching precaution.
- Data: correct calculations and units, graphs with the gradient and intercept used, and percentage errors.
- Evaluation: anomalies found and explained, weaknesses named with an improvement for each, and the adequacy of repeats and range.
- Conclusion: the key features of the data, whether they support the prediction, and the chemical reason.
1. The Paper and the Planning Frame
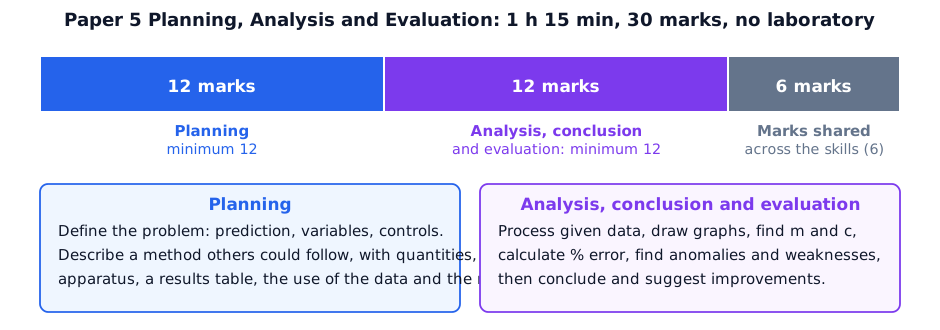
Paper 5 is a written paper of 30 marks with two or more questions. No laboratory is needed, but you must be able to picture the apparatus and the procedure exactly. Information that you are not expected to know is given in the paper.
Define the problem first. Every plan starts with an aim, a prediction and the variables. Use the same frame every time.
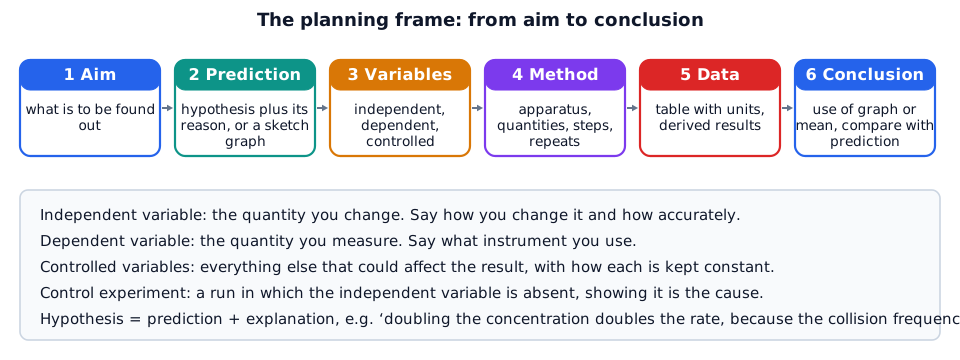
| Term | Meaning | Example (rate against concentration of HCl) |
|---|---|---|
| independent variable | the quantity you change | concentration of HCl, 0.50 to 2.00 mol dm−3 |
| dependent variable | the quantity you measure | volume of H2 at 15 s intervals, giving the initial rate |
| controlled variable | everything else that could change the result | temperature, mass and surface area of Mg, volume of acid |
| control experiment | a run that shows the cause | the same experiment with water in place of acid (no reaction) |
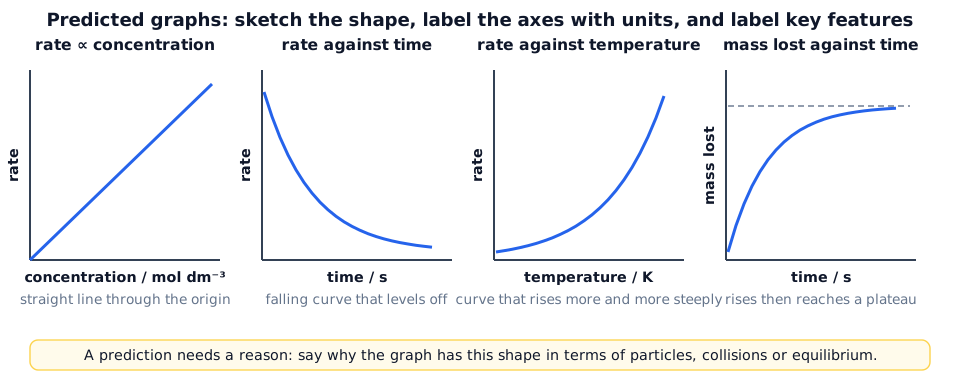
Hypothesis. A prediction becomes a hypothesis when you give the reason. For example: ‘the initial rate is directly proportional to the concentration of HCl, because doubling the concentration doubles the number of H+ ions per unit volume, so the frequency of successful collisions with the Mg surface doubles.’ You may be asked to show the prediction as a sketch graph.
2. Writing a Method
A method is marked as a procedure that another student could follow without asking you anything. The syllabus lists what it must contain: quantities, apparatus, steps, how to vary and measure variables, repeats, a table, how to use the data and the risks. Write it as numbered steps or a flowchart, and add a labelled diagram if the set-up is complicated.
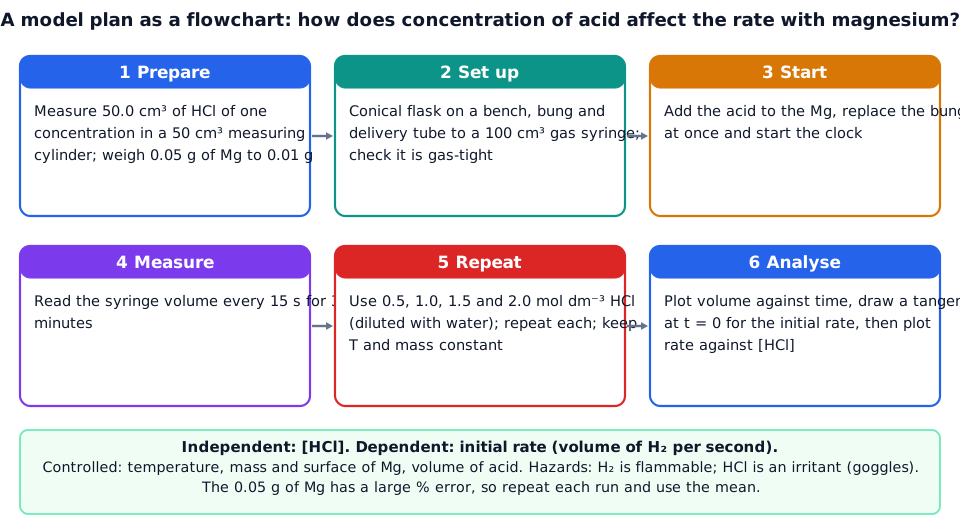
Choose suitable quantities. The amount of reagent must suit the apparatus. For a gas, calculate the mass of solid that gives a little less than the capacity of the syringe or burette.
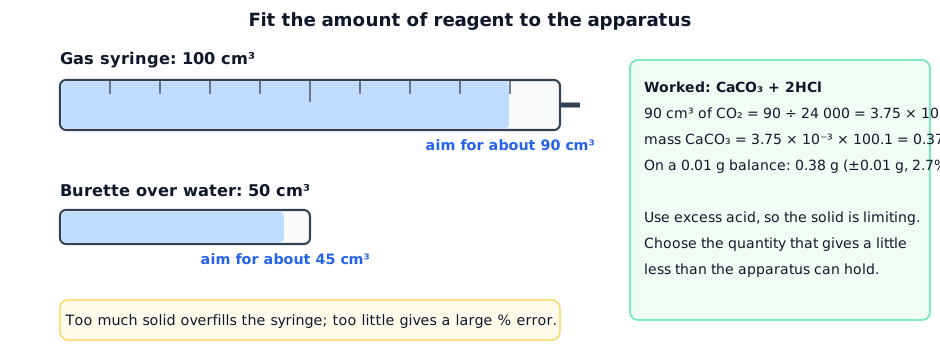
Worked example. In the plan in the flowchart, 0.05 g of magnesium reacts with excess hydrochloric acid, Mg + 2HCl → MgCl2 + H2. Show that the volume of hydrogen fits a 100 cm3 gas syringe, and that 50.0 cm3 of 0.50 mol dm−3 HCl is in excess. [3]
Moles of Mg = 0.05 ÷ 24.3 = 2.06 × 10⁻³ mol [1]. Moles of H2 = 2.06 × 10⁻³, so the volume = 2.06 × 10−3 × 24 000 = 49 cm3, less than 100 cm3 [1]. Moles of HCl = 0.50 × 50.0 ÷ 1000 = 0.025 mol, which is far more than the 2 × 2.06 × 10−3 = 4.1 × 10⁻³ mol needed, so the acid is in excess [1].
Standard solutions and titrations. Plans often include making a solution of known concentration or a titration. State the steps in order, with the apparatus.
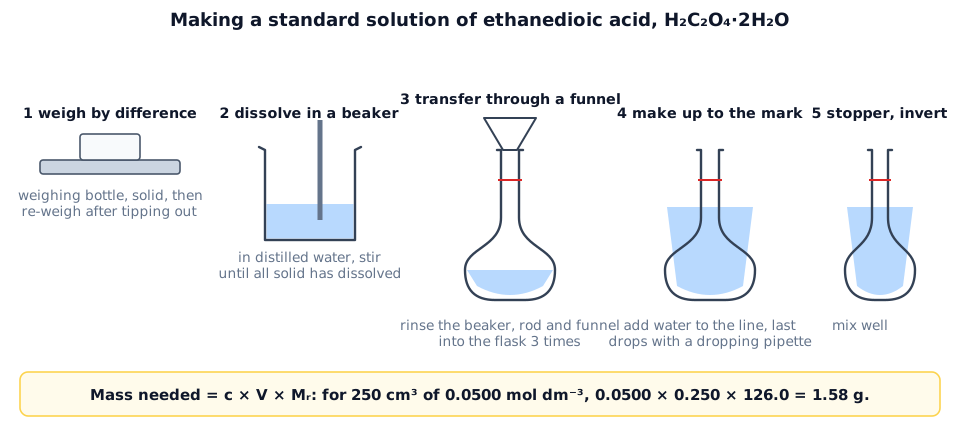
Worked example. Calculate the mass of ethanedioic acid dihydrate, H2C2O4•2H2O (Mr = 126.0), needed to make 250 cm3 of a 0.0500 mol dm−3 standard solution. [2]
Moles = 0.0500 × 250 ÷ 1000 = 0.0125 mol [1]. Mass = 0.0125 × 126.0 = 1.58 g (weigh by difference to 0.01 g) [1].
Weighing by difference. Weigh the container with the solid, tip the solid into the vessel, weigh the container again, and subtract. The results table has three columns: mass of container and solid / g, mass of container after transfer / g and mass of solid transferred / g.
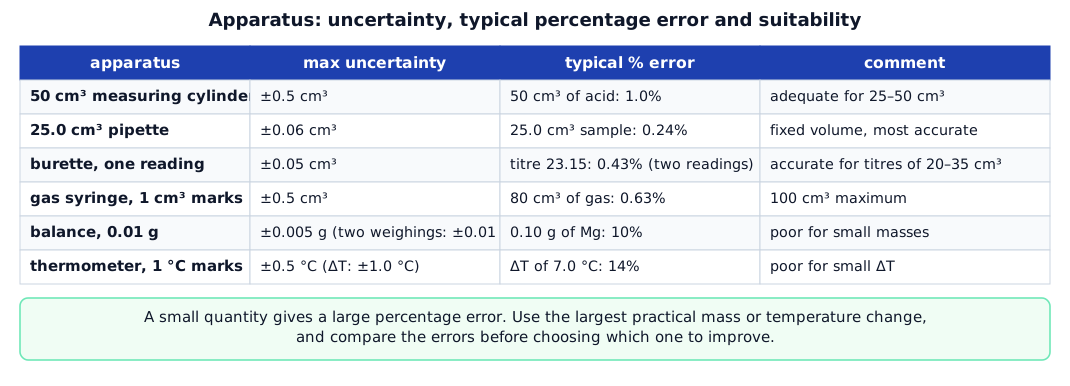
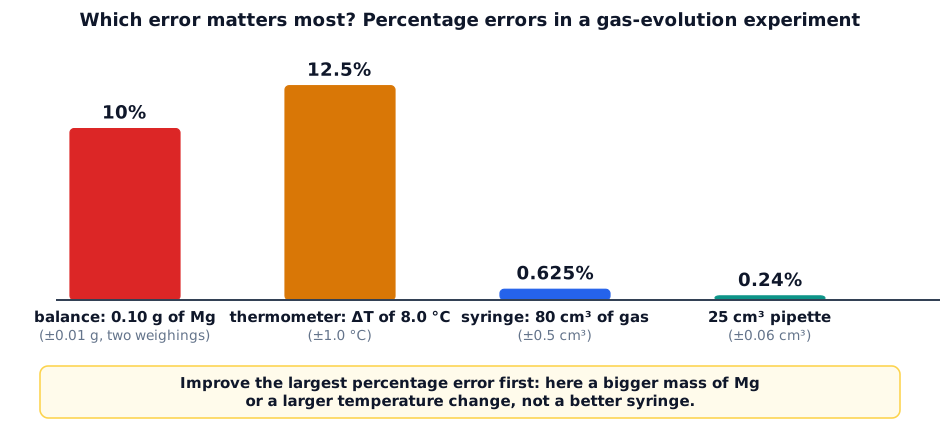
Choose appropriate apparatus. Compare the percentage error of each measurement and choose the instrument that suits the size of the quantity. A measuring cylinder is adequate for 25–50 cm3 of acid in an enthalpy experiment, but a balance is poor for 0.10 g of magnesium.
Risk assessment. Name the specific hazard and give the matching precaution. The question may state whether a substance is harmful, corrosive or toxic.
Results tables. Include a column for every raw quantity and for every derived quantity, with quantity / unit headings, and a row or column for each repeat. Show how a derived value is obtained, for example (1 ÷ t) / s−1.
Using the data. End the plan by saying what you will plot or calculate and how it tests the prediction: ‘plot the initial rate against concentration; if the line is straight through the origin, the rate is directly proportional to concentration.’
3. Dealing with Data
You are given results and must decide what to calculate, what to plot and what the graph shows. First process the raw data into derived results (mass of solid, titre, rate, 1 ÷ t) with units and sensible significant figures: the same as, or one more than, the data provided.
| Calculation | How | Example |
|---|---|---|
| mean | sum of values ÷ number of values; do not quote more precision than the readings have | (23.15 + 23.20 + 23.15 + 23.25 + 23.15) ÷ 5 = 23.18 cm3 |
| median | the middle value when the data are in order | 23.15 cm3 |
| mode | the most common value | 23.15 cm3 |
| percentage loss or gain | change ÷ original value × 100 | (2.50 − 2.13) ÷ 2.50 × 100 = 14.8% loss |
| percentage error | uncertainty ÷ measured value × 100 | 0.01 g ÷ 0.10 g = 10% |
Choose what to plot. Rearrange the equation so that it has the form y = mx + c, then plot y against x. A straight line shows the relationship; the gradient and intercept give the quantities.
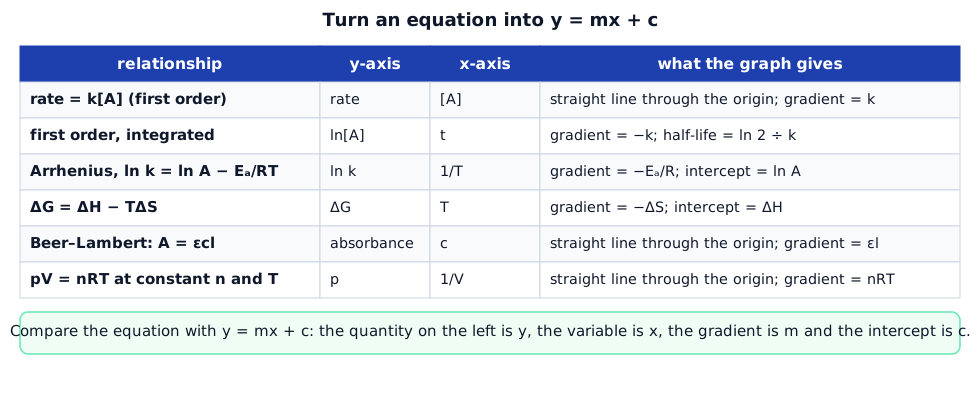
Worked example. The graph shows ln k against 1/T for a reaction. Use it to find the activation energy. R = 8.31 J K−1 mol−1. [3]
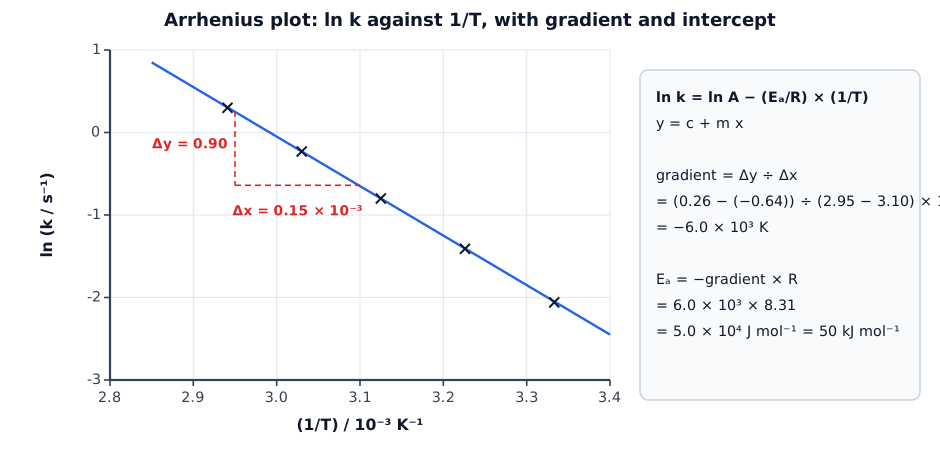
ln k = ln A − (Ea/R)(1/T), so the gradient is −Ea/R [1]. Gradient = (0.26 − (−0.64)) ÷ ((2.95 − 3.10) × 10−3) = 0.90 ÷ (−0.15 × 10⁻³) = −6.0 × 10³ K [1]. Ea = 6.0 × 103 × 8.31 = 5.0 × 10⁴ J mol−1 = 50 kJ mol−1 [1].
Cooling-curve extrapolation. When a reaction is slow or heat is lost, the highest temperature measured is lower than it would be for an instantaneous reaction. Take temperature readings before mixing, mix at a stated time, continue recording, and extrapolate the cooling line back to the time of mixing.

Worked example. In the graph, 50.0 cm3 of acid containing 0.0500 mol of HCl is added to a solid at 3.0 minutes. Use the extrapolated temperature rise of 14.2 °C to calculate ΔH. [3]
q = m × c × ΔT = 50.0 × 4.18 × 14.2 = 2968 J [1]. ΔH = −2968 ÷ 0.0500 = −59 400 J mol−1 [1] = −59.4 kJ mol−1, negative because the temperature rose [1].
Percentage error and apparatus. Compare the percentage errors of the different measurements; the largest one limits the experiment.
4. Evaluation
Evaluation questions ask you to judge the quality of the experiment: the anomalies, the repeats, the range, the control of variables, the apparatus and the method. Answer with specific points from the data, not general statements.
Anomalies. An anomalous result does not fit the pattern. Label it, give a possible cause and say how to deal with it: repeat it and, in drawing a line of best fit, ignore it.

| Deviation | Likely cause (examples) | Effect on a calculated result |
|---|---|---|
| residue mass too large | incomplete heating or reaction; solid not dried | unreacted starting material is included |
| residue mass too small | overheating, so the product decomposed; solid spat out | product is lost or changed |
| gas volume too small | gas escaped before the bung was replaced; CO2 dissolved; leak in the apparatus | calculated moles too low |
| temperature rise too small | heat lost to the surroundings; incomplete mixing | the magnitude of ΔH is too small |
| titre too large | air bubble in the tip, burette not rinsed; overshoot of the end-point | calculated concentration of the analyte too high |
| rate too slow or fast | temperature not constant; different mass of solid or surface area | points scatter from the line |
Repeats and range. Results are reliable if repeats agree (for example titres within 0.10 cm3) and the points lie close to the line of best fit. Say whether the data are replicated, and the benefit: a mean reduces the effect of random errors and shows an anomaly. The range is adequate when it covers the interesting region; to test the trend, extend it above or below the existing values or take more readings near a changing gradient or an inflexion point.
Control of variables. Use the data to judge whether a variable was controlled. For example, if the starting temperatures differ by 3 °C in an experiment on the effect of concentration, the temperature was not effectively controlled, and the rate differences may not be due to concentration alone.
Weaknesses and improvements. Give the weakness, why it matters and a specific change. Decide which is the main weakness by comparing the sizes of the errors.
| Weakness | Improvement |
|---|---|
| heat loss in a thermometric experiment | insulate and use a lid; take readings before and after mixing and extrapolate |
| end-point of the disappearing cross is subjective | use a colorimeter or light sensor to measure absorbance against time |
| small mass of solid (large % error) | use a larger mass with a larger apparatus, or a balance that reads to 0.001 g |
| gas escapes while the bung is replaced | place the solid in a small tube inside the flask and tip it in with the bung already fitted |
| few repeats | repeat each measurement at least three times and calculate a mean |
| narrow range of the independent variable | extend the range and take more readings |
| the thermometer is not accurate enough | use a thermometer or temperature probe reading to 0.1 °C |
5. Conclusions
A conclusion describes the key features of the data, says whether they support the prediction, and gives the chemical reason. Quote the numbers.
Worked example. A student predicts that the rate is directly proportional to the concentration of thiosulfate. A graph of 1 ÷ t against concentration is a straight line through the origin with a gradient of 0.500 dm3 mol−1 s−1 and one anomalous point. State a conclusion. [3]
The line of best fit is straight and passes through the origin, so 1 ÷ t, and therefore the rate, is directly proportional to the concentration [1]. The prediction is supported (apart from the anomalous point, which was ignored) [1]. This is because doubling the concentration doubles the frequency of collisions, so the rate doubles [1].
Comments on quality. Use these ideas. Data are valid if they can prove or disprove the prediction, and reliable if repeats agree and no points are anomalous. If an error in a result is small compared with the measurement uncertainty, it can be explained by measurement error; if it is much larger, other factors (heat loss, incomplete reaction) must be responsible.
Further predictions. A good conclusion ends by asking a new question that can be tested: ‘the same experiment with a different acid’, ‘the rate at a higher temperature’ or ‘the effect of a catalyst’, with the expected result and its reason.
6. Quick Sheet and Checklist
| Topic | What to remember |
|---|---|
| hypothesis | prediction + reason; sketch graph with labelled axes |
| variables | independent, dependent, controlled (with how), control experiment |
| method | quantities, apparatus, ordered steps, repeats, table, use of data, risks |
| gas volume | gas syringe 100 cm3, burette 50 cm3; choose the mass for about 90% |
| standard solution | calculate, weigh by difference, dissolve, transfer with rinsings, make up, mix |
| data | derived results, mean, % loss, y = mx + c, gradient, intercept, extrapolation |
| errors | % error = uncertainty ÷ value × 100; improve the largest |
| evaluation | anomaly, repeats, range, control of variables, weakness with improvement |
| conclusion | key features, support or not, chemical reason, further prediction |
- [ ] I can write a hypothesis with a reason and sketch the predicted graph with labelled axes.
- [ ] I can name the independent, dependent and controlled variables and explain how each is varied, measured or kept constant.
- [ ] I can write a numbered plan with quantities, apparatus, repeats, a results table and the use of the data.
- [ ] I can calculate a mass or volume that suits the apparatus, and describe how to make a standard solution.
- [ ] I can give the hazard and the matching precaution for a stated substance or procedure.
- [ ] I can process data to find a mean, a percentage loss or gain and a percentage error, and plot y = mx + c to find a gradient and intercept.
- [ ] I can extrapolate a cooling curve, identify an anomaly and explain it, and judge the range and the replicates.
- [ ] I can state the main weakness of a procedure with a specific improvement, and write a conclusion that says whether the data support the prediction.